Ultra-Short Trading
Scalping operates on the philosophy that small moves are easier to capture than large ones. While a swing trader might wait days for a 5% move, a scalper targets a 0.1% to 0.3% change dozens of times a day. It is the "death by a thousand cuts" applied to market volatility. In practice, a scalper looks for imbalance. For instance, if a large buy order hits the Nasdaq 100 (NDX) futures, a scalper enters a long position to ride the momentary momentum for 2–3 points and exits before the mean reversion begins. According to 2024 market data, high-frequency trading (HFT) accounts for nearly 50% of stock market volume in the US. Scalpers essentially act as manual versions of these algorithms, seeking "pockets" of liquidity where retail platforms like Interactive Brokers or TD Ameritrade (Charles Schwab) provide the necessary execution speed.
Execution Pain Points
Most novice traders treat scalping like gambling, leading to a 90% failure rate within the first six months. The primary issue is the "Negative Expectancy Trap." If you win $10 on nine trades but lose $150 on the tenth because you didn't set a stop-loss, your strategy is mathematically doomed. Latency is another silent killer. Using a standard web-based broker interface introduces "slippage"—the difference between your requested price and the filled price. In scalping, a slippage of just 2 ticks can turn a profitable day into a net loss after accounting for exchange fees. Psychological burnout is the final hurdle. The cognitive load required to monitor Level 2 tapes and 1-minute charts for four hours straight often leads to "revenge trading." This occurs when a trader loses a series of small positions and attempts to "make it back" by doubling their lot size, usually resulting in a margin call.
Strategic Frameworks
Mastering the Order Book and Level 2 Market Depth
Understanding "where the money sits" is more important than any lagging indicator like the RSI. Level 2 data shows the pending limit orders on both the bid and ask sides. By using tools like Bookmap or Sierra Chart, you can see "liquidity walls"—large clusters of sell orders that act as temporary price ceilings. When price approaches a large sell wall and starts "eating" through it (increasing volume at the ask), it signals a breakout. Scalpers enter exactly at the moment of depletion. This method works because it is based on real-time supply and demand rather than historical price averages.
Utilizing Exponential Moving Averages (EMA) for Trend Micro-Bursts
A classic setup involves the 9-period and 21-period EMAs on a 1-minute or 2,000-tick chart. Scalpers look for the "fan-out" effect. When the 9 EMA crosses above the 21 EMA and the slope of both lines increases, it confirms short-term momentum. For example, on an E-mini S&P 500 (ES) chart, a pullback to the 9 EMA during a strong trend provides a high-probability entry point. The target is the previous micro-high, often reached in under 120 seconds. Platforms like NinjaTrader allow for "Atmospheric Orders" where stop-losses and take-profits are submitted the millisecond the entry is filled.
Arbitrage and Correlation Scalping
Highly correlated assets, such as the SPY ETF and the individual top-weighted stocks like Apple (AAPL) or Microsoft (MSFT), often move in tandem but with slight time offsets. If the S&P 500 index starts to tank, but Apple is lagging by a few seconds, a scalper shorts Apple. This is often called "tape reading." By monitoring the "Time and Sales" window, you can see large institutional "blocks" being traded. If you see a flurry of red prints (sales at the bid), the immediate path of least resistance is down. Professional scalpers often use multi-monitor setups to track these correlations simultaneously.
The Volatility Scalp: Using Bollinger Bands
In sideways markets, scalpers use Bollinger Bands set to a 2.0 standard deviation. The strategy involves shorting the upper band and buying the lower band, but only when the "squeeze" (narrowing of the bands) has ended. The key is to look for a "wick rejection." If a 1-minute candle touches the upper band and closes with a long upper shadow, it indicates that the price is being pushed back into the value area. This move typically yields 5–10 pips in Forex pairs like EUR/USD, where liquidity is deep enough to prevent massive slippage.
Risk Management: The 1% Rule and Fixed Ratios
The only way to survive scalping is to treat it as a business of statistics. Successful scalpers never risk more than 0.5% to 1% of their total account balance on a single trade. If you have a $10,000 account, your maximum loss per trade should be $50. Using a "Fixed Ratio" approach, a trader might aim for a 1.5:1 reward-to-risk ratio. While this sounds low, a 65% win rate with this ratio generates significant compounded returns. Tools like Myfxbook can help track these metrics to ensure the "Profit Factor" remains above 1.25.
Platform and Infrastructure
Infrastructure is your biggest competitive advantage. A "retail" connection with 100ms latency cannot compete with a VPS (Virtual Private Server) located near the exchange servers in Chicago (CME) or New York (NYSE). Traders often use "Direct Market Access" (DMA) brokers like Lightspeed or Interactive Brokers (Tiered pricing) to minimize costs. Unlike "Zero Commission" brokers that sell your order flow (PFOF) to market makers like Citadel, DMA brokers send your order directly to the exchange, ensuring faster fills and better prices.
Execution Case Studies
Case Study 1: The Tech Sector Breakout
A private trader focused on the QQQ ETF noticed a heavy "iceberg" buy order at $440.00 during the first 15 minutes of the New York session. Every time the price hit $440.00, it bounced back immediately. The trader entered a long position with 500 shares at $440.05, placing a stop-loss at $439.95. Within 45 seconds, the price moved to $440.25 as the iceberg order held firm.
Result: $100 profit in under one minute. Total risk was $50. Repeatable 4 times during the session for a $400 daily gain.
Case Study 2: Crypto Mean Reversion
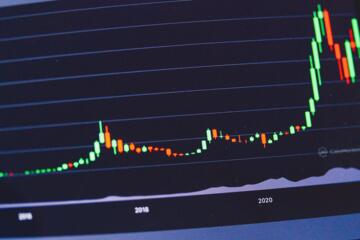
During a period of high volatility in Bitcoin (BTC), a trader used the 1-minute chart on Binance Futures. BTC spiked 2% in three minutes, moving far outside the upper Bollinger Band. Identifying a "Climax Volume" bar on the Volume Profile, the trader opened a short position.
Result: The price reverted to the 20-period Mean within 2 minutes. The trader captured a $60 move per BTC, netting $300 across 5 BTC units after fees.
Scalping Tool Comparison
| Tool / Broker | Primary Use Case | Key Advantage | Approx. Cost |
|---|---|---|---|
| NinjaTrader | Futures Trading | Advanced Charting & Automation | Free (Basic) / $1499 Lifetime |
| Bookmap | Liquidity Visualization | Real-time Heatmaps of Limit Orders | $49 - $99/mo |
| Interactive Brokers | Execution / DMA | Low Latency & Global Access | $0.0035 per share (Tiered) |
| TradingView | Analysis | Cloud-based alerts & PineScript | $15 - $60/mo |
| Sierra Chart | Professional Scalping | Ultra-low CPU usage & Customization | $26 - $56/mo |
Pitfalls and Defense
The most frequent mistake is "Overtrading." It is easy to rack up $200 in commissions while only making $150 in profit. To avoid this, set a daily "Max Trades" limit. If you haven't hit your goal after 20 trades, walk away. The market becomes less predictable during the "lunch doldrums" (12:00 PM – 2:00 PM EST). Another error is "Picking Tops" in a parabolic move. Just because a stock has gone up 10% in 5 minutes doesn't mean it has to go down. Scalpers should trade with the trend, not against it. Use the VWAP (Volume Weighted Average Price) as a "Polarity Line"—only buy when price is above VWAP and only sell when below.
FAQ
Is scalping profitable for beginners?
It is the hardest style for beginners due to the required speed and discipline. Most beginners should start with paper trading on platforms like Thinkorswim to master execution before risking real capital.
How much capital do I need to start?
For US stocks, the Pattern Day Trader (PDT) rule requires $25,000. However, for Futures (CME) or Forex, you can start with as little as $1,000 to $2,000 using micro-contracts (e.g., MES instead of ES).
What is the best timeframe for scalping?
Professional scalpers rarely look at anything above the 5-minute chart. The most common timeframes are the 1-minute chart, the 15-second chart, or Tick-based charts (e.g., 500-tick).
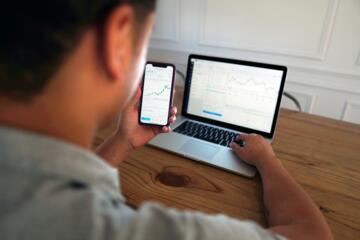
Can I scalp using a mobile app?
No. Scalping requires sub-second execution and a high-speed data feed. Mobile apps introduce too much latency and lack the depth-of-market (DOM) views necessary for professional-grade scalping.
What is the best time of day to scalp?
The first 90 minutes of the market open (9:30 AM – 11:00 AM EST) and the last hour (3:00 PM – 4:00 PM EST) provide the highest volume and volatility needed for small-move captures.
Author’s Insight
In my years of trading, I’ve found that the most successful scalpers are those who act like robots. They don't care about the company's "vision" or the long-term economy; they only care about the next 30 seconds of price action. My biggest piece of advice: invest in your hardware. A high-refresh-rate monitor and a hardwired fiber-optic internet connection will save you more money in the long run than any "magic" indicator ever could. If your platform lags for even a second, you aren't trading—you're guessing.
Summary
Scalping is a high-precision discipline that requires a unique blend of technical expertise, low-latency infrastructure, and emotional detachment. By focusing on order flow, utilizing Level 2 data, and maintaining a strict risk-management protocol, traders can extract consistent profits from the market's noise. The key is not to find one "big win," but to master the process of capturing small, high-probability movements repeatedly. Start by optimizing your execution environment, stick to liquidity-rich assets, and never trade without a hard stop-loss.