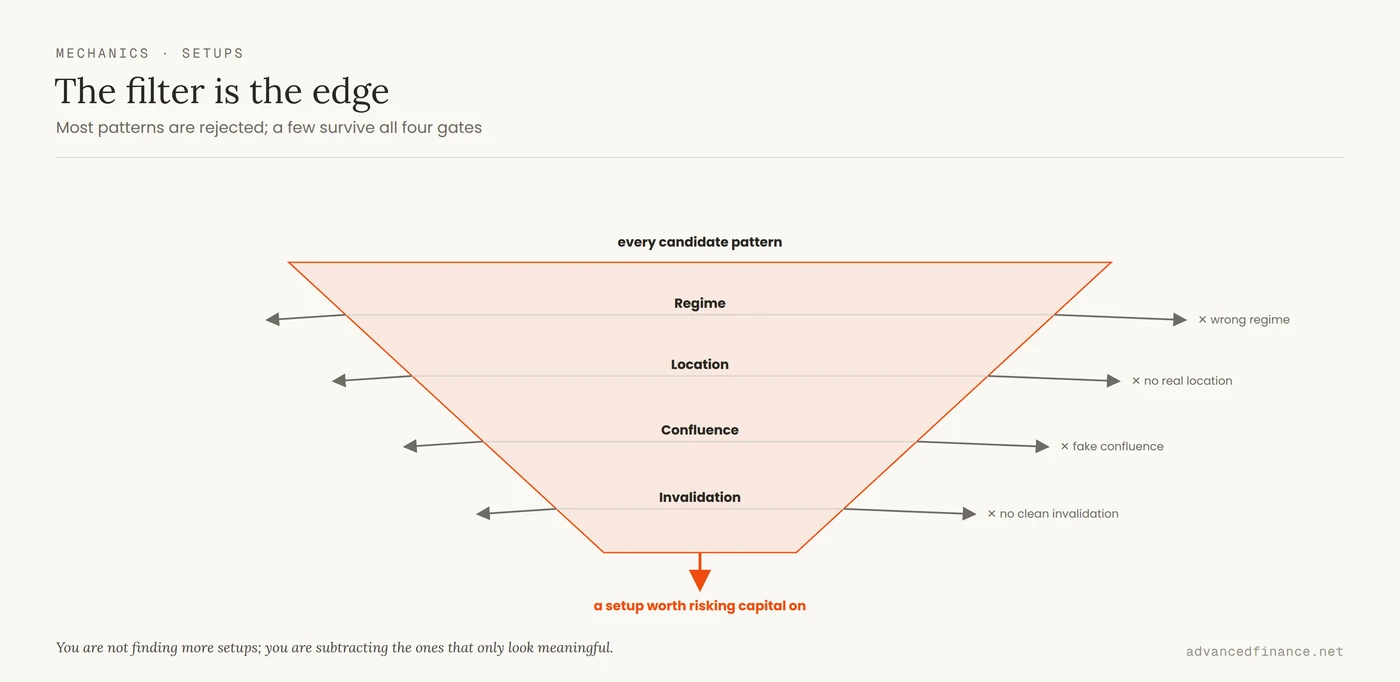
“High-probability setup” is one of the most confident phrases in trading, and one of the emptiest. Nobody can know the probability of a single trade before it happens — the market has not run the experiment yet. What a good setup actually gives you is not a promise but a hypothesis: a repeatable condition that, in the past, tended to precede a move, paired with a price that proves the idea wrong. The traders who consistently find high-probability trades are not better at predicting; they are better at filtering — at throwing away the patterns that only look meaningful and keeping the few that survive context, location, and their own record. This guide is about that filter, because the pattern itself is almost never the edge.
A Setup Is a Hypothesis
Reframe the whole idea and the noise falls away. A setup is a testable claim: “if price does X here, it should do Y, and if it does Z instead, I was wrong.” That last clause — the invalidation — is what separates a setup from a hunch. A hunch has no exit; a setup has a specific price that ends the argument, and that price is your stop — the anchor of the risk management that keeps you from blowing up the account. Everything that makes a setup “high-probability” is really about raising the odds that the hypothesis is right and tightening the point at which you admit it is wrong. If you cannot state, out loud, the exact condition that would invalidate your trade, you do not have a setup. You have a wish, and the market charges full price for wishes.
The Pattern Isn't the Edge
Open any chart and you will find pin bars, flags, and double bottoms scattered everywhere, most of them followed by nothing. The pattern is common; the edge is not. The reason so many traders overrate a clean-looking pattern is a documented quirk of judgment: in their classic work, Kahneman and Tversky showed that people judge probability by how well something matches a mental template and systematically ignore the base rate — how often that pattern actually works. A textbook pin bar looks like a reversal, so the brain files it as one, regardless of the fact that most pin bars fail; falling for the familiar shape is part of the wider psychology that keeps traders acting on feeling instead of evidence. The edge, when it exists, comes from the filter you wrap around the pattern: independent conditions that each have to agree before you act. Real confluence means two or three uncorrelated signals lining up — a level, a regime, and a trigger — not five indicators that are all just smoothed versions of price saying the same thing twice. Stacking correlated indicators feels like confirmation and adds none.
Trade With the Regime
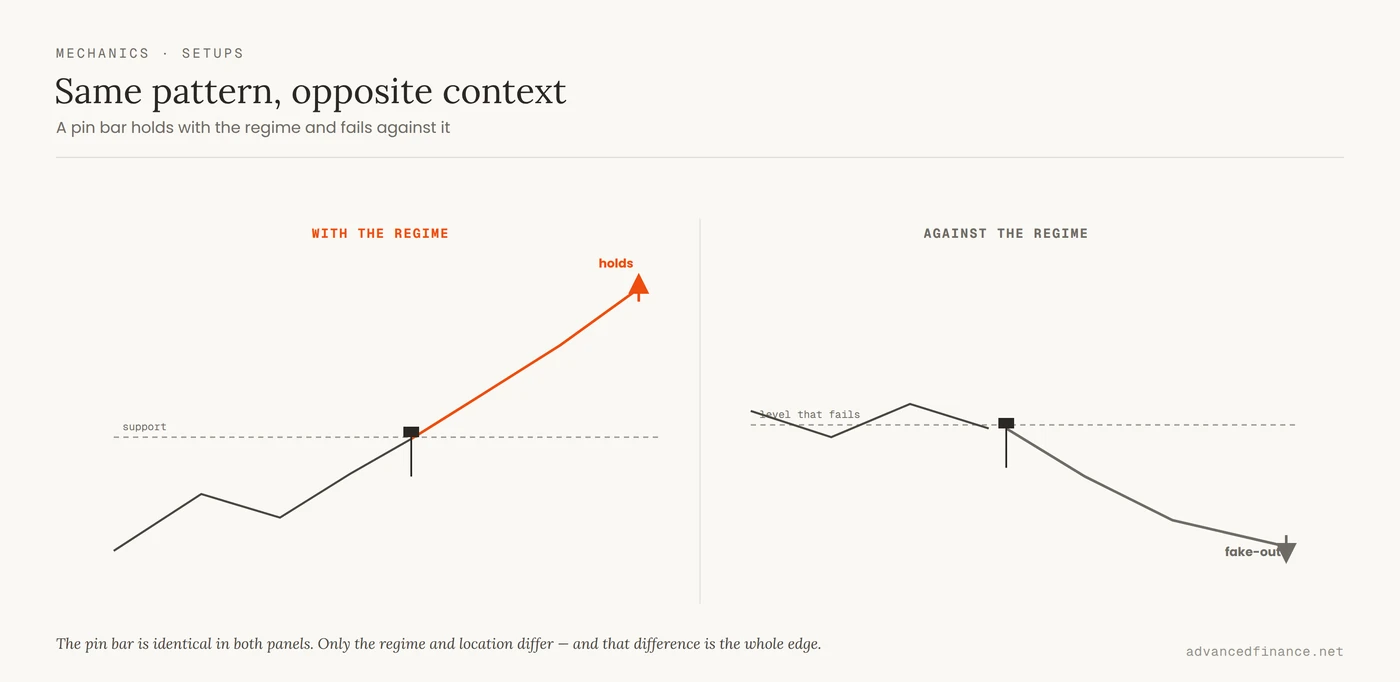
The single biggest filter is context, and it is the one beginners skip. The exact same pattern is a high-probability trade in one environment and a trap in another. A breakout is worth taking when the market is trending and expanding; the identical breakout in a quiet, range-bound tape is usually a fake-out engineered to trap momentum buyers before price snaps back. So the first question is never “what is the pattern?” but “what regime am I in — trend or range, expanding or contracting?” and “does this setup belong to that regime?” A setup taken against the prevailing regime is not high-probability no matter how textbook it looks, which is a large part of why strategies that look flawless on paper fail live: they were only ever valid in the one regime the backtest happened to sample.
Enter Where Others Are Trapped
The highest-probability locations share a feature: they are places where other traders are forced to act. Price is not a lonely line; it is a record of orders, and the best entries sit right where a crowd of stops and pending orders is stacked. When price sweeps just below an obvious support level and reverses, what happened is not magic — larger participants pushed price into the cluster of stop-losses resting there, used that forced selling to fill their own buy orders, and turned. The value-area edges of heavy prior trading act the same way, as magnets and as decision points. The practical rule is blunt: if you cannot see where the trapped traders are, you are probably one of them. Reading a chart as a map of where others must react — rather than as a set of shapes — is what turns a generic level into a location worth risking money on, and it is the same order-flow logic that governs where a durable trading edge actually comes from.
One Setup, Filtered
Make it concrete. Take the most ordinary setup there is — a pullback to support inside an uptrend — which on its own is close to a coin flip. Run it through the four filters and watch it change character:
| Filter | Low-probability version | High-probability version | How to measure it |
|---|---|---|---|
| Regime | Against trend, quiet tape | Aligned with an expanding trend | Price above a rising 50-period average; ADX above ~25; ranges (ATR) widening, not shrinking |
| Location | Mid-range, no reference | At a tested level or value-area edge | A prior breakout level or high-volume node, with stops likely resting just beyond it |
| Confluence | One signal, or several correlated | Two to three independent signals | Signals from different families: structure + trend + a momentum reset, not three price-derived indicators |
| Invalidation | Vague or mental stop | A specific price that voids the idea | Just beyond the swing low, e.g. swing low − 0.5×ATR — if price trades there, the thesis is dead |
With all four aligned, the trade almost writes itself: enter as price confirms off the level, place the stop below the invalidation, and target the prior swing high or a measured move — frequently two to three times the risk. Skip any single filter — take it against the trend, in the middle of nowhere, on one indicator, with a fuzzy stop — and the same pullback collapses back into a guess. Before you click, it helps to force the hypothesis into words. A pre-execution log with five lines does exactly that:
- Pattern: the shape you see (e.g. pullback to support).
- Regime: trend or range, expanding or contracting — and does the setup belong to it?
- Location: the exact level or value area, and where the trapped orders sit.
- Confluence: the two or three independent signals that agree.
- Invalidation: the precise price that proves you wrong.
If you cannot fill in all five, you do not have a high-probability setup — you have a chart you find attractive, which is a different and more expensive thing.
Prove the Probability Yourself
Here is the uncomfortable part: the only honest source of a setup’s probability is your own logged record, and it takes more samples than you think. A handful of good trades tells you almost nothing — a run of luck looks identical to an edge over a small sample, and the mathematics of overfitting are brutal. Bailey, Borwein, López de Prado and Zhu showed how easily a strategy tuned on too little data produces an impressive result that is pure noise. So treat every setup as a hypothesis you are still testing: log each one, tag it by type, and track its real base rate over a meaningful sample — dozens of trades at the very least, and closer to a hundred before you would bet size on the number. This is also where the honest limit of “high-probability” shows up in the account statements of active traders — Barber and Odean’s study of thousands of real accounts found the most active traders underperformed the market, in large part because they mistook frequent, familiar-looking patterns for genuine edges. And never forget the other half of the equation: probability is worthless without payoff. A setup that comes good less than half the time can still be excellent if its reward dwarfs its risk, which is the full logic of win rate versus reward-to-risk.
FAQ
How many indicators should I use?
Fewer than you think, and uncorrelated. Two or three signals that measure different things — say a level, a trend filter, and a trigger — give real confluence. Five indicators derived from the same price data just tell you the same thing repeatedly and create false confidence.
What time frame is best for finding setups?
The one you can actually test and trade consistently. Higher time frames produce fewer but cleaner setups with less noise; whichever you choose, align your entry with the regime on a higher time frame, because a setup that fights the larger trend is rarely high-probability.
Should I trade setups during news events?
Usually not, unless the reaction to the news is your setup. Scheduled releases break technical levels, widen spreads, and cause slippage, which quietly destroys the thin edge most setups carry. If you do trade them, size down and expect worse fills.
How do I know if a breakout is real?
You do not in advance — that is the point. A breakout earns trust when it holds above the level on a retest with genuine participation rather than a single thin spike. Treat the first push as a hypothesis with a tight invalidation, and let price confirm before adding.
When should I pass on a good-looking setup?
Whenever it fails a filter, however textbook the pattern looks. A clean shape in the wrong regime, with no real location, or resting on a single indicator is a pass — discipline is mostly the setups you decline. The payoff side matters too: if the reward-to-risk is thin, skip it, for the reasons laid out in win rate versus reward-to-risk above.
Author’s Insight
For years I collected setups like trading cards — the more patterns I could name, the more of an expert I felt. My results did not improve until I did the opposite and threw most of them out. I kept exactly two setups, both of which only trigger in a specific regime and at a specific kind of location, and I wrote down the precise price that would tell me each one had failed. The hard discipline was not learning new patterns; it was sitting on my hands when a beautiful chart appeared in the wrong context, because my log had taught me that the same shape in the wrong regime was a coin flip with commissions attached. The number of trades I take fell by more than half. The quality of the ones left is the only reason the account curve turned.
Bottom Line
“High-probability” is a hypothesis, not a promise, and the probability is unknowable until your own record earns it. The pattern is never the edge; the filter is — regime first, then location where other traders are forced to act, then genuine confluence, then a hard invalidation. Stop hunting for more setups and start subtracting: keep the few that survive the filter, log them honestly until their real base rate is clear, and never forget that a high win rate is only worth having when the payoff behind it is worth more. Trade the conditions you can prove, not the shapes you can see.