There's a particular heartbreak every systematic trader knows: a strategy with a gorgeous backtest — a smooth equity curve climbing left to right — that quietly bleeds money the moment real capital touches it. The usual explanation is a checklist of technical leaks: add slippage, add a regime filter, forward-test. That advice is correct as far as it goes — and further down I'll get concrete about how to do each part — but on its own the checklist misses the deeper point.
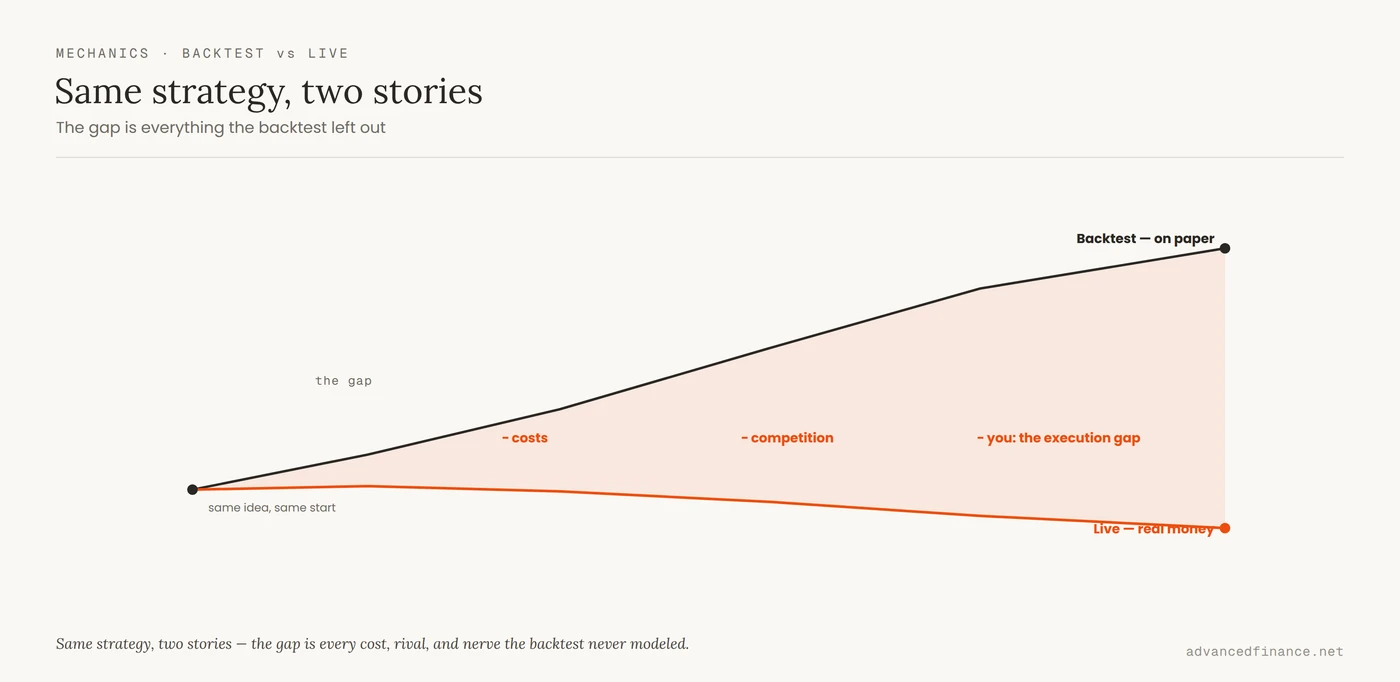
After years of building and killing systems, I've come to believe most strategies don't fail because the idea was wrong. They fail because the backtest measured a fantasy — a version of the market with no costs, no competition, and no you — and because the very act of polishing a paper curve until it's beautiful is often what destroys the edge. This piece is about that gap between paper and reality, and how to stop being fooled by it.
A Backtest Is Not Evidence
Start by demoting the backtest in your mind. It is not proof; it is a hypothesis about the past, run under assumptions you chose. Regulators understand this so well they require it in writing: any simulated or hypothetical track record marketed in the U.S. must carry a disclaimer that "these results do not represent actual trading" and that no representation is made that any account will achieve similar profits or losses (CFTC Regulation 17 CFR 4.41). When the law makes you print "this isn't real," you should take the hint.
And "works on paper" says nothing about whether the code survives contact with a live venue. In 2012, Knight Capital's trading software malfunctioned and fired off millions of unintended orders, costing the firm roughly $440 million in about 45 minutes before it could be stopped (SEC, Knight Capital). No backtest contains that failure mode. The real question a backtest can't answer is the only one that matters: was there ever a genuine edge here once the real world takes its cut — whether the edge was ever real after costs?
The Costs You Didn't Model
The first thing the real world takes is its cut. A backtest usually fills you at the price on the chart; a live market makes you cross the spread, pay commissions, and accept slippage when your order moves the price — and if you trade anything illiquid, that slippage can be brutal. Hold positions overnight and financing or swap costs quietly compound against you. None of this appears on the pretty curve.
| Real-world cost | What the backtest assumed | What actually happens |
|---|---|---|
| Spread & slippage | Filled at the chart price | You cross the spread and move the price |
| Commissions & fees | Often zero | Charged on every entry and exit |
| Financing / swaps | Ignored | Compounds against overnight positions |
| Competition | You're alone | Faster players take the best fills first |
Individually these look small; together they routinely flip a paper winner into a live loser, because they attack the exact thing your profit depends on. A strategy that looked good only because its average win barely exceeded its average loss has no cushion left once costs arrive — which is why understanding the reward-to-risk that costs quietly invert matters more than the headline return.
Put rough numbers on it. Say a backtest shows an average edge of 0.30% per trade. Now subtract the real world: roughly 0.05% commission on each side (0.10% round-trip) plus about 0.10% given up to the spread and slippage, and you're already down near 0.10% — a third of the paper edge, before any financing. The frictional decay fits on one line: real expectancy ≈ paper expectancy − (round-trip commission + spread and slippage + financing per trade). Trade something less liquid, or in larger size, and those same costs can erase the edge entirely.
Why Pretty Curves Lie
Here's the counterintuitive part: the more beautiful the backtest, the more suspicious you should be. Every time you tweak a parameter to smooth the equity curve, you risk fitting the strategy to the random noise of that specific history rather than to anything repeatable. Test enough variations and you'll always find one that looks brilliant — by luck alone, which is exactly why feeding a model more big data multiplies the ways to fool yourself.
This isn't a hunch; it's math. Researchers have shown that with enough trials it's trivial to produce an impressive backtest that has zero real edge, and that the more configurations you try, the more the in-sample results overstate what you'll get out of sample (Bailey, Borwein, López de Prado & Zhu, Notices of the AMS). Survivorship bias (testing only the companies that didn't go bust) and look-ahead bias (letting the strategy peek at data it wouldn't have had) inflate the illusion further. A curve that's too clean isn't reassurance — it's a warning that you've optimized yourself into a corner.
To make it concrete: test twenty variations of a rule and the best one will show a handsome curve by luck alone — and the more variations you try, the more history you'd need before that winner means anything. Professionals call this data-snooping and correct for it directly, discounting a strategy's apparent quality by the number of trials behind it (a "deflated" Sharpe ratio does exactly that). It's the same reason "live" indicators that quietly repaint after the fact, or data that wasn't truly point-in-time, are so dangerous: they let the past look far more predictable than it ever really was.
You Are the Missing Variable
Even a genuinely profitable system has one component the backtest never simulates: the human running it. On paper, every trade is taken mechanically. In life, you skip the trade after two losses, override the one that "feels wrong," and abandon the whole system during the drawdown that always comes before the recovery. That behavior gap is where most real edges die.
The trap is that a real strategy's losing streaks are not a malfunction — they're a normal feature of its distribution, and they usually arrive before the winning stretch that pays for them. If your position size is large enough that a normal drawdown scares you out, you'll quit at the worst possible moment. This is why the survivability of a system depends less on its peak return than on sizing that lets you survive the drawdown before the edge shows up. The best strategy you can't hold through a bad month is worse than a mediocre one you can.
Test It Like It's Real
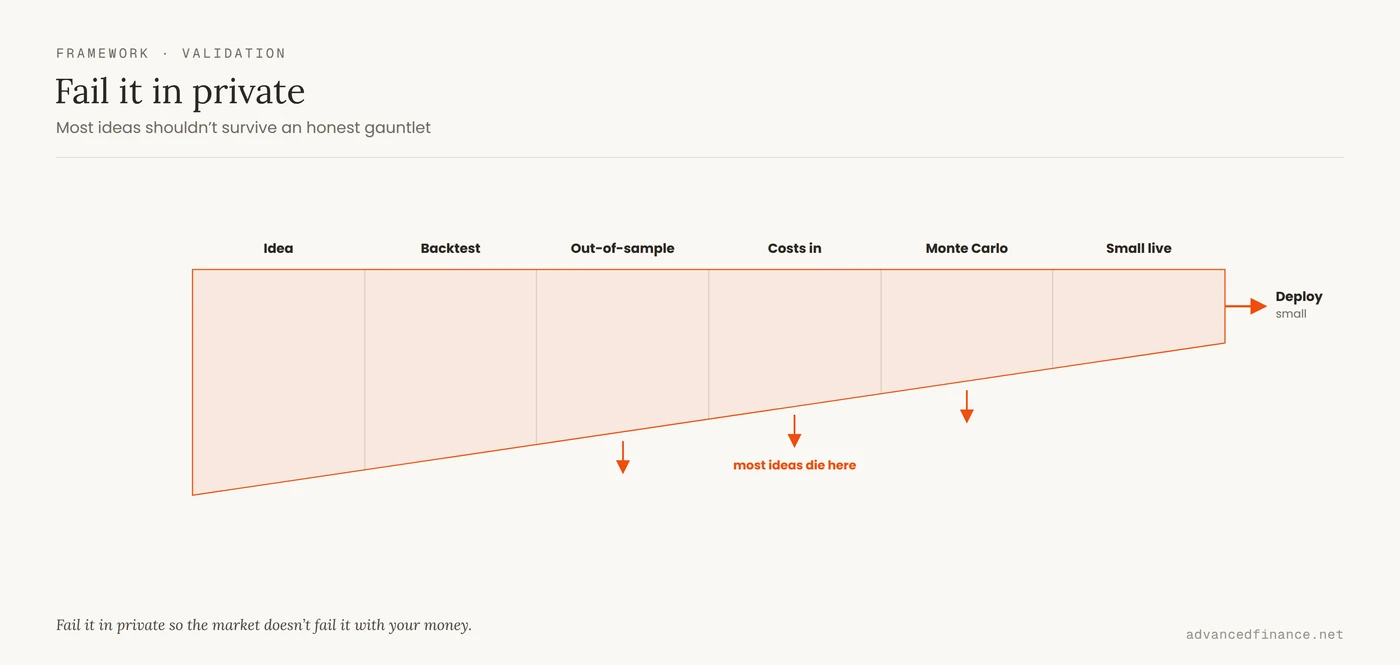
None of this means backtesting is useless — it means you have to test as if you're trying to break the strategy, not flatter it. The goal is to fail it in private so the market doesn't fail it with your money.
| Check | What it catches | What a pass looks like |
|---|---|---|
| Out-of-sample / walk-forward | Overfitting to one history | Holds up on data it never saw |
| Costs and slippage included | The friction illusion | Still profitable after generous costs |
| Sequence stress (Monte Carlo) | Hidden risk of ruin | Survives reshuffled trade orders |
| Small live account | The execution and behavior gap | Real fills track the plan |
Model costs punitively
Don't plug in a flat, hopeful slippage figure. Model it as a function of size and liquidity — bigger orders in thinner markets should cost more — and charge commission on both sides of every trade. If the edge only survives optimistic fills, it isn't an edge.
Walk it forward
Optimize your parameters on an early slice of history, then test them on the next slice the strategy has never seen; roll that window forward and repeat. If performance holds on each unseen segment, you have evidence. If it only shines on the exact data you tuned to, you have a curve fit wearing a disguise.
Reshuffle the sequence
Your historical trade order is just one of countless possible orderings. Shuffle it thousands of times — a Monte Carlo test — and look at the range of outcomes rather than the single lucky path. If a meaningful share of those reshuffles wipe the account, your edge or your sizing is too fragile to trust.
Discount for how many you tried
Every extra idea you test raises the odds that your best result is noise. Keep count and haircut the winner accordingly: the more variants sit behind a backtest, the more skeptical its Sharpe ratio deserves to be. A modest edge found on the first try is worth more than a spectacular one found on the two-hundredth.
Two habits sit underneath all of this. Assume live results will be materially worse than the paper curve and demand the strategy still works with that margin of safety. And only trade setups you can define precisely enough to test in the first place — a rule you can't write down clearly is one you can't validate, which is half of a setup you can actually define and test.
FAQ
Why does my strategy work on a demo account but fail on live?
A demo fills you instantly at the quoted price and carries none of the emotional weight of real money. Live, you pay the spread, get partial or slipped fills, compete with faster players, and feel every loss — so both the costs and your own behavior change the results. The demo tested the idea; live tests the idea plus the friction plus you.
How much slippage and cost should I build into a backtest?
Model it as a function of size and liquidity rather than a flat number, and charge commission on both sides. A useful discipline is to subtract costs straight from your per-trade edge — round-trip commission plus spread and slippage plus financing — and see what's left. If the edge only survives near-zero costs, it isn't real.
How many trades do I need before I trust a backtest?
More than feels convincing, spread across trending, ranging, and volatile regimes — and crucially, adjusted for how many ideas you tried. Testing dozens of variants is data-mining, so the more you tested, the larger the sample you need before the winner means anything. Even then, only out-of-sample results count as evidence.
Isn't a higher backtested return always better?
Usually it's the opposite warning sign. A suspiciously high, smooth curve often means overfitting, and it will collapse out of sample. Judge robustness instead — a modest edge that holds across regimes, costs, and reshuffled sequences, ideally scored with a metric that penalizes the number of trials (a deflated Sharpe ratio) — not the peak number.
Can AI or machine learning fix this?
Not on its own; it often makes it worse. More parameters mean more ways to fit noise, so machine-learning models are especially prone to overfitting when aimed at predicting price direction. AI can help with narrow tasks like regime detection, but it doesn't remove trading costs, latency, or the execution gap — and it makes a pretty, misleading backtest easier to produce, not harder.
Author's Insight
The strategies that have actually made me money are almost embarrassingly plain compared to the elegant ones I've retired. I once ran a genuinely clever model that behaved beautifully in testing and then fell apart the first time liquidity vanished and the fills went wild — the market simply didn't offer the prices my backtest assumed. What has survived instead are simple, robust systems with heavy safety buffers, sized so a bad stretch is uncomfortable rather than fatal. I've learned to read a spectacular backtest not as a promise but as a temptation, and to ask a colder question than "how much did it make?" — namely, "could I actually run this, unchanged, through the worst week of the last decade?" If the answer is no, the return on paper is irrelevant.
Bottom Line
A backtest is a best-case story about a market that no longer exists, told without the costs, the competition, or your own nerves in the room. Strategies fail live because those three forces are real and the paper curve pretended they weren't — and because chasing an ever-prettier curve is itself a way of fitting noise. Treat the backtest as a hypothesis to attack, not a result to trust: include punishing costs, test out of sample, stress the sequence, start small, and size to survive the drawdown that precedes the payoff. In the market, survival is the prerequisite for profit — and the plain strategy you can actually hold beats the elegant one you can't.