
A correlation coefficient looks like a fact — a hard number between −1 and +1 telling you whether two assets move together. It is really a photograph of a relationship during one particular stretch of history, and relationships change. The number that matters most to anyone holding a balanced portfolio — how stocks and bonds move together — is not a constant of nature; it flips sign depending on what is driving the market, and it flipped at the worst possible moment in 2022. This guide is about that one relationship, because understanding why it moves is worth more than any static correlation matrix, and because the tool most investors reach for — a table of historical correlations — is precisely what fails them when it counts. The deeper theory of why correlation is an unreliable input belongs to modern portfolio theory; here the focus is the single live regime shift reshaping balanced portfolios right now.
Correlation Is a Regime
Start with what a correlation number actually is: an average, measured over some past window, of how two assets moved together. Change the window and you change the number. That makes it less a property of the assets than a description of the era you happened to measure. The mistake is treating it as permanent — building a portfolio on the assumption that because two things were uncorrelated for the last decade, they will stay that way. Correlations are not stable; they cluster, they drift, and in the moments that matter most they tend to converge, because a large enough shock drags almost everything the same direction at once. A correlation is a regime you are currently living in, not a law you can bank on.
The One That Matters Most
Of all the correlations in a portfolio, one dominates the rest: how stocks and bonds move together. It is the entire premise of the balanced portfolio — the 60/40 and every variation of it — that when stocks fall, bonds hold or rise and cushion the blow. For most of the last quarter-century that held: bonds were a reliable hedge, moving opposite stocks. But that negative relationship is not the historical norm — it is a feature of a specific era, and eras end. Assume the stock-bond hedge is permanent and you have built your whole defense on a number that stays true only until the regime turns.
Why the Sign Flips
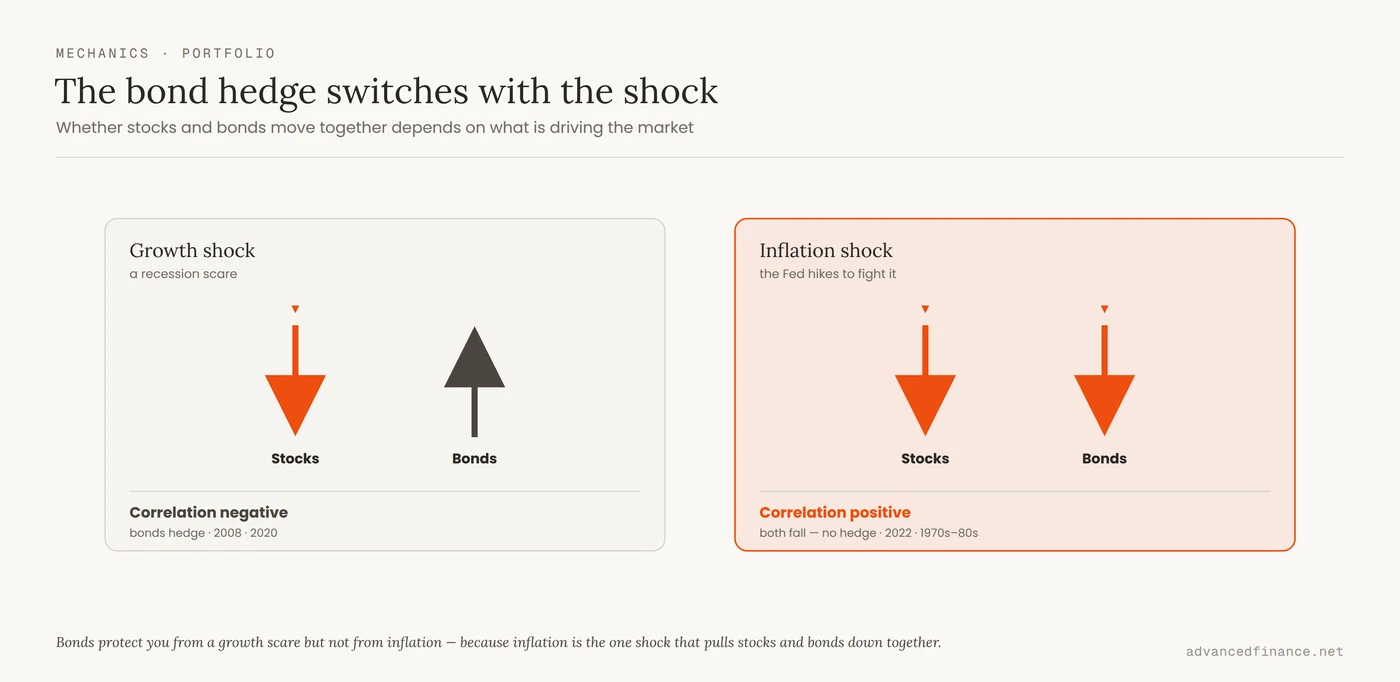
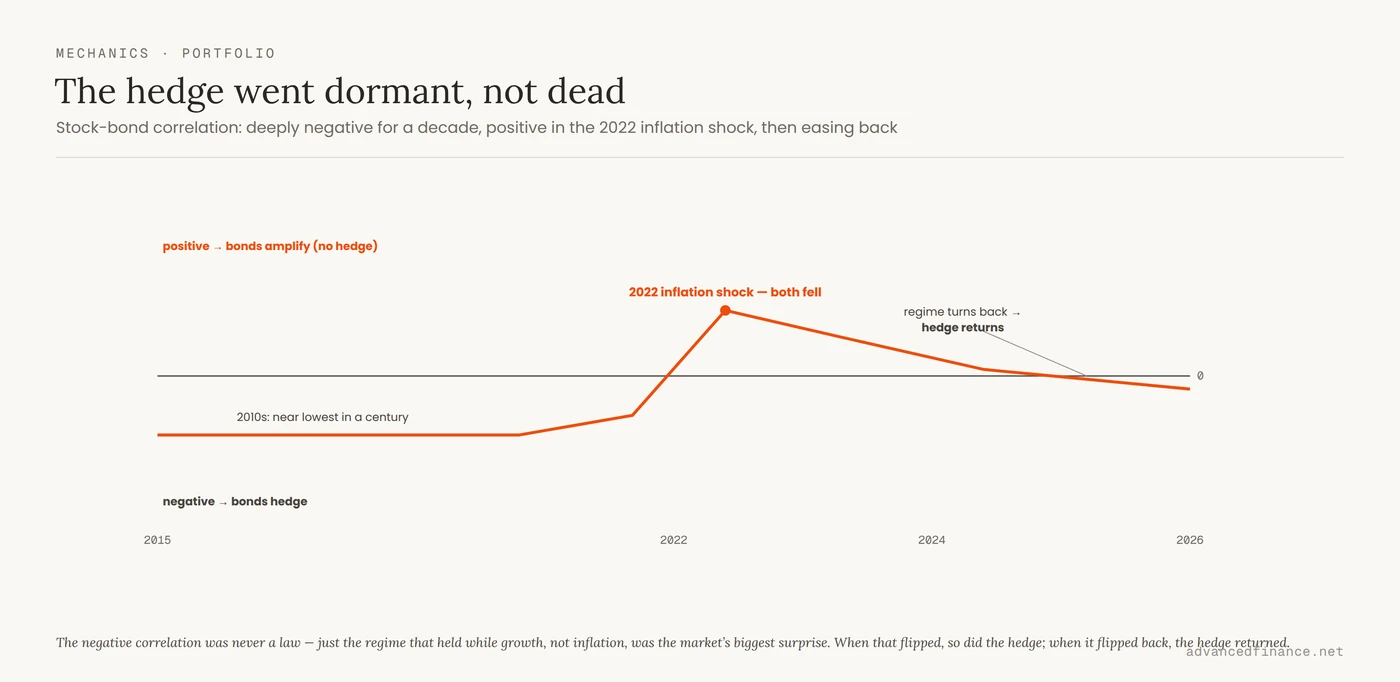
The sign of the stock-bond correlation is not random; it is set by which kind of shock is driving markets, and the mechanism is clean. As economists at Econofact explain, when the dominant force is a growth shock — a recession scare — the correlation is negative: growth fears push stocks down while the Fed responds by cutting rates, which pushes bonds up, so bonds hedge. When the dominant force is an inflation shock, the correlation turns positive: the Fed has to raise rates to fight inflation even into a slowdown, and higher rates hurt stocks and bonds at the same time. Bonds hedge you against a growth scare; they cannot hedge you against inflation, because inflation is the one thing that damages both at once. Research by AQR sharpens the point: what really decides the sign is whether inflation surprises or growth surprises dominate, and through the 2010s the stock-bond correlation sat near its lowest level in more than a century — deeply negative. That single rule explains a fact that blindsided a generation: the correlation was reliably negative from around 2000, but it was positive through the inflationary 1970s and 1980s — and it turned positive again in 2022.
2022: The Hedge Failed
2022 was the mechanism in the open. The Federal Reserve raised rates at the fastest pace in four decades to fight the worst inflation in forty years, and stocks and bonds fell together — the balanced portfolio’s ballast turned to lead exactly when it was needed. A standard 60/40 portfolio lost 17.5% that year, its worst result since 1937 and its fourth worst in two centuries; stocks and bonds have finished a year negative together only 16 times ever, roughly an 8% chance in any given year. Investors who owned bonds “for diversification” discovered their diversifier had quietly recorrelated to their stocks, because the shock driving the market was the one kind bonds cannot absorb. Nothing in a backward-looking correlation table warned them — the table was an average of the calm decades that came before.
| Dominant shock | Stock-bond correlation | Does the bond hedge work? | Example |
|---|---|---|---|
| Growth shock (recession scare) | Negative | Yes — bonds rise as the Fed cuts | 2008, 2020 |
| Inflation shock | Positive | No — both fall as the Fed hikes | 2022, 1970s–80s |
And here is the part that actually confirms the framework rather than denting it: the story did not end in 2022. As inflation cooled from its roughly 9% peak, the shock driving markets shifted back toward growth, the stock-bond correlation began to ease, and the balanced portfolio rebounded strongly through 2023 and 2024 — by 2025 the 60/40 had regained its footing. The hedge did not die in 2022; it went dormant for exactly as long as the inflation shock dominated, then returned when the regime turned. That is the whole thesis in one arc: bonds are not a permanent hedge or a broken one — they are a hedge whose usefulness switches with the shock. The mistake in 2022 was never owning bonds; it was believing the negative correlation was a law rather than a regime.
The Backtest Trap
This is the trap a correlation matrix sets: it is a rear-view mirror sold as a windshield. Two assets negatively correlated for ten years can turn positive in a single quarter when the macro regime shifts, and the historical number gives you false confidence right up to the moment it inverts. The most vivid recent example is not even stocks and bonds — it is crypto, marketed for years as an “uncorrelated” asset, whose correlation to equities climbed as institutions adopted it until it was falling in lockstep with the Nasdaq in every risk-off scare. Same lesson, different asset: a low historical correlation is not a promise, and the holdings that look most independent in a calm backtest are often the ones that converge hardest in a crash. Add an asset because you understand why it should behave differently, never because a spreadsheet says it once did.
Diversify by Driver
So the practical move is to stop diversifying by coefficient and start diversifying by driver. Ask what each holding actually responds to — growth, inflation, real interest rates, liquidity — and make sure you own things that answer to different forces, not merely things that happened to show low correlations in the last backtest. Against a growth shock, high-quality bonds still do their job. Against an inflation shock — the one that broke 2022 — the hedges are different: real assets, commodities, inflation-linked bonds, and plain cash, which finally pays a real return again. There is a hard-nosed consequence worth naming: when the correlation rises, a balanced portfolio’s total risk rises with it, so keeping your volatility where you want it means holding fewer stocks in a positive-correlation regime, not more — the diversification you lost has to be paid for in equity exposure. Read the regime rather than the spreadsheet: when inflation is the dominant risk, expect your stock-bond hedge to weaken, and do not be surprised when “uncorrelated” assets start moving together. A correlation matrix is a useful description of where markets have been. It is a dangerous forecast of where they are going, and the whole discipline is knowing the difference.
FAQ
Why did stocks and bonds fall together in 2022?
Because the shock was inflation, not growth. When the Fed hikes aggressively to fight inflation, higher rates hurt stocks and bonds at the same time, so the stock-bond correlation turns positive and bonds stop hedging. The result was the 60/40’s worst year since 1937.
Did the 60/40 portfolio recover after 2022?
Yes, strongly. As inflation cooled from its roughly 9% peak, the dominant shock shifted back toward growth, the stock-bond correlation eased, and the balanced portfolio rebounded through 2023 and 2024, regaining its footing by 2025. That recovery is not a refutation of the 2022 warning — it confirms that the hedge is regime-dependent, working again once the inflation shock passed.
Can I rely on a historical correlation matrix?
Only as a description of the past, never as a forecast. Correlations shift with the macro regime, and two assets uncorrelated for a decade can move together within a quarter. The durable question is what each asset responds to, not what its coefficient happened to be.
What actually diversifies against inflation?
Not nominal bonds. Real assets, commodities, inflation-linked bonds, and cash — which now pays a real yield — respond differently to an inflation shock, whereas stocks and nominal bonds are both damaged by it. That is why an inflation regime needs a different hedge than a growth regime.
Isn’t crypto an uncorrelated diversifier?
Less than advertised. Bitcoin’s correlation to equities rose as institutions adopted it, and it now tends to fall alongside the Nasdaq in risk-off episodes — another case of a low historical correlation that broke exactly when the diversification was needed.
Author’s Insight
The single most useful shift in how I think about risk was to stop asking “what is the correlation?” and start asking “what is this asset actually responding to?” A coefficient told me bonds would protect me; the mechanism told me they would protect me against a recession and not against inflation — a completely different and far more useful thing to know. In 2022 the people who owned the mechanism were unsurprised, and the people who owned the coefficient were blindsided. I keep a short list now, not of correlations but of drivers — growth, inflation, real rates, liquidity — and I check that I am not quietly making the same bet four different ways. The math is a description. The logic is the edge.
Bottom Line
A correlation coefficient is a photograph of a relationship in one regime, and the most important relationship in a balanced portfolio — stocks versus bonds — changes sign depending on whether growth or inflation is driving the market. It was negative and dependable for a generation, which lulled investors into treating the stock-bond hedge as permanent; then 2022 delivered an inflation shock, the sign flipped positive, both fell together, and the 60/40 had its worst year since 1937 — before rebounding through 2023–2024 as inflation cooled and the shock regime turned back toward growth. The hedge was dormant, not dead. The lesson is not to hunt for a magic uncorrelated asset but to diversify by driver rather than by coefficient: know what each holding responds to, expect “uncorrelated” assets to converge in a large enough shock, and read the macro regime instead of the backtest. The correlation matrix describes where markets have been. It has never once told you where they are going.