The title of every risk-management guide promises the same thing — how to never blow your account — and almost all of them answer the wrong question. They treat risk management as the art of avoiding losses. It is not. You cannot avoid losses; they are the cost of doing business, and any method that tries to dodge them just hides the risk until it arrives all at once. Real risk management is the math of survival: controlling the size and velocity of your losses so that the losing streak you are guaranteed to hit — every trader does — cannot end you before your edge has a chance to pay. Blowing up is almost never one catastrophic trade. It is a string of ordinary losses taken at a size you could not afford.
Survival Comes First
Trading is one of the few games where you can be right about direction and still lose everything, because the order in which wins and losses arrive is out of your control. A run of losses can hit at the start, before a single winner shows up, and if your position sizes are large enough, that opening streak takes you out of the game permanently — there is no later winning trade if you are already at zero. So the first job of risk management is not profit; it is staying at the table. Everything else — your edge, your win rate, your reward-to-risk — only matters if you are still solvent to trade it. The odds do not favor the reckless: Barber and Odean’s study of thousands of accounts found the most active traders underperformed the market, exactly the traders who treat every session as a chance to press rather than to survive. This is why the ones who last are rarely the boldest; they are the ones who made sure no single stretch of bad luck could be fatal.
The Asymmetry of Losses
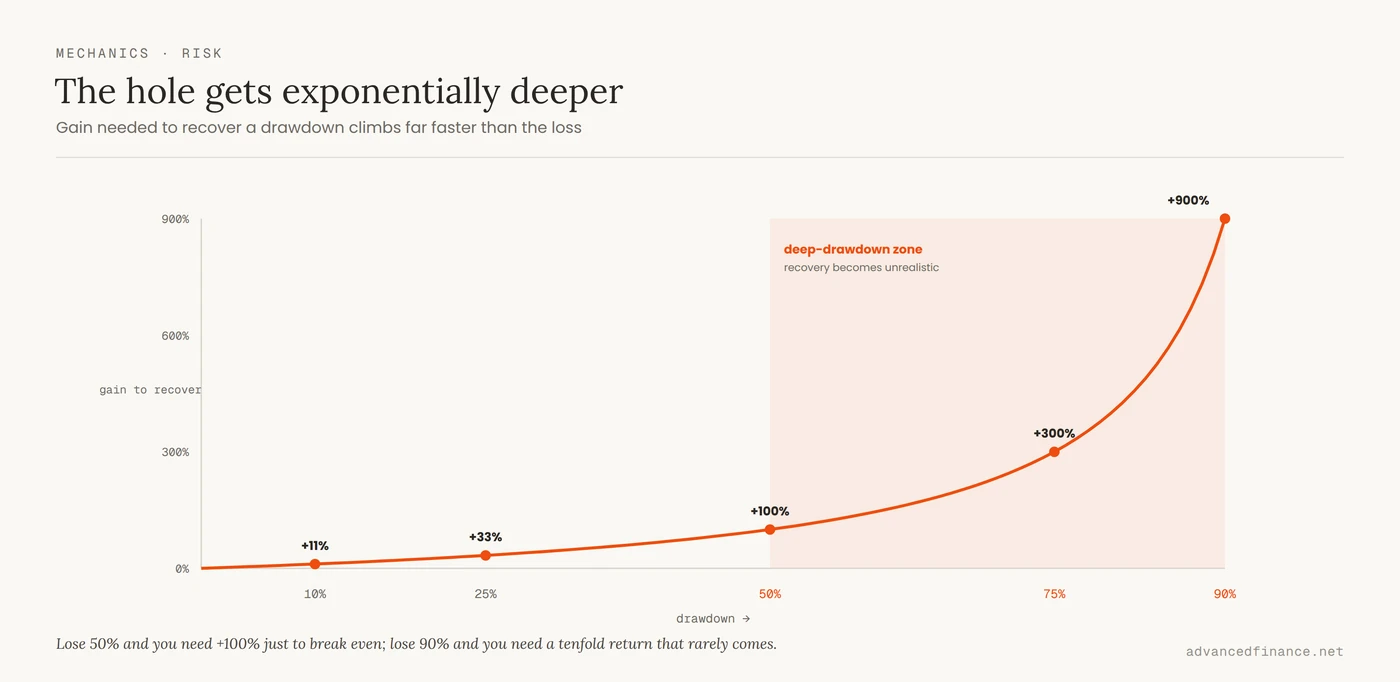
The reason a big drawdown is so dangerous is arithmetic, not sentiment: losses and the gains needed to erase them are not symmetric. Lose 10% and you need about 11% to get back to even — annoying but survivable. Lose 50% and you now need a 100% gain just to break even, which can take years. Lose 90% and you need a tenfold return, which realistically never comes. The hole gets exponentially harder to climb out of the deeper you dig it:
| Drawdown | Gain needed to break even | Winning trades to recover (at +2% each) |
|---|---|---|
| 10% | +11% | ~6 |
| 25% | +33% | ~15 |
| 50% | +100% | ~35 |
| 75% | +300% | ~70 |
| 90% | +900% | ~117 |
This single table is the whole reason for the phrase “never blow up.” A shallow drawdown is a setback; a deep one is a career change. Every rule that follows exists to keep you in the top rows of this table and out of the bottom ones.
Because the deep rows are so hard to escape, the practical move is to cap the damage before it compounds, with circuit breakers set in advance. A daily loss limit ends your session once you are down, say, 3% on the account — the single best defense against revenge trading. A size cut kicks in once you are down about 5%, halving your risk per trade until you recover. And a hard stop to reassess the whole strategy triggers at a 15% drawdown, before an ordinary bad run turns into one of the bottom rows. The tiers matter more than the exact numbers: decide them when you are calm, because you will not decide them well mid-loss.
Size Is the Master Lever
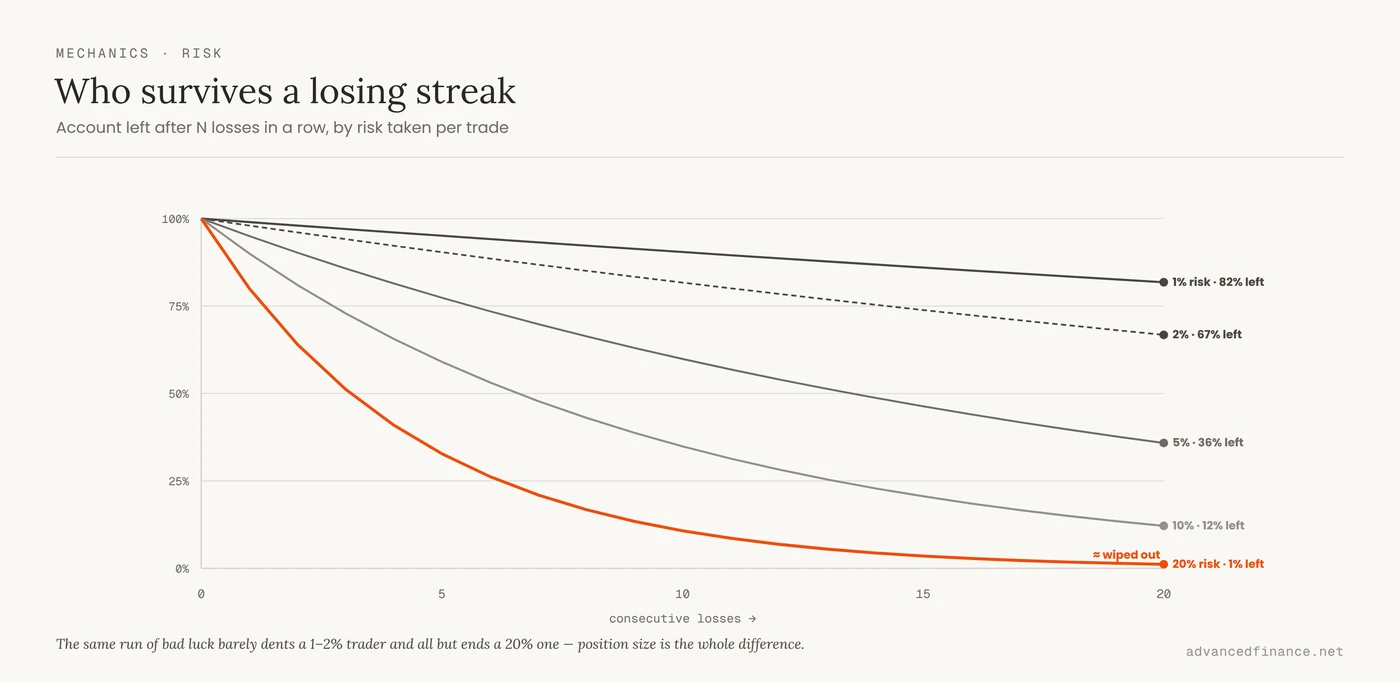
Here is the idea that reorganizes everything: the stop-loss decides where you are wrong, but position size decides how much it costs — and size is the lever that actually controls your risk of ruin. Risk a fixed small fraction of your account on each trade — the common rule is 1% to 2% — and no plausible losing streak can bury you. Risk too much, and even a genuine edge cannot save you, because a normal cold streak compounds against you. Watch what the same losing streak does at different bet sizes:
| Risk per trade | After 10 straight losses | After 20 straight losses |
|---|---|---|
| 1% | ~90% left | ~82% left |
| 2% | ~82% left | ~67% left |
| 5% | ~60% left | ~36% left |
| 10% | ~35% left | ~12% left |
| 20% | ~11% left | ~1% left |
At 1% a trader shrugs off a brutal twenty-loss streak; at 20% the same streak is a funeral. The mathematics of betting a fraction of your capital — formalized decades ago in the Kelly criterion, and softened in practice to a fraction of it because full Kelly is too wild for real markets — all point the same way: bet small enough to survive variance, because variance is guaranteed. Leverage is the same lever pulled the wrong way. Borrowed money magnifies position size and therefore risk of ruin, which is why the SEC’s investor education describes buying on margin as borrowing that magnifies losses just as much as gains. Size is the one dial that turns a survivable business into a lottery ticket.
Size a Trade in One Line
All of this collapses into a single formula you can run before every trade:
Position size = (account × risk %) ÷ (entry price − stop price).
Say you have a $10,000 account and cap risk at 1%, so $100 is the most you will lose on the trade. You buy at $50 with your stop at $48 — a $2 risk per share. Divide: $100 ÷ $2 = 50 shares, a $2,500 position. If the stop hits, you lose exactly $100, or 1%, no matter how “sure” the trade felt. Notice what sets the size: not your conviction, but the distance to your stop. A tight stop lets you hold more shares for the same risk; a wide stop forces fewer. That is the whole discipline — the market’s structure sets your risk per share, and the formula sets the size, so your emotions never get a vote.
The deeper version of this is the Kelly criterion, which says the optimal fraction to bet rises with your edge and falls with your odds. In real markets full Kelly is far too aggressive — its swings would gut most accounts — so professionals trade a half or a quarter of it, which for typical edges lands right back in that 1–2% zone. The reason to stay there is the risk of ruin: as a rough guide it behaves like ((1 − edge) ÷ (1 + edge)) raised to the number of risk units in your account, a number that collapses toward zero when each bet is small and rockets toward certainty when it is large. Bet small and even a modest edge almost never ruins you; bet large and a genuine edge still can, because a long enough losing streak eventually arrives for everyone.
The Stop Marks Being Wrong
Most traders set a stop where the loss stops hurting emotionally — a round dollar figure they can stomach — and then wonder why they keep getting stopped out right before price reverses. The order is backwards. A stop belongs at the price that proves your trade idea wrong: below the structure, past the level, wherever the reason you entered no longer holds. You find that price first, and only then do you size the position so that hitting it costs your fixed 1–2%. Do it the other way and you are letting the size you wish you could trade dictate where you pretend the idea fails. The reason this is so hard to follow is not ignorance but wiring: Kahneman and Tversky showed that a loss hurts about twice as much as an equivalent gain feels good, so the instinct is to widen or cancel the stop to avoid the pain of realizing the loss — the same fear and greed that make traders hold losers far too long. A hard stop taken automatically beats a mental stop negotiated in the moment, every time. And the stop only works if it was defined the same way a high-probability setup is: as a clear invalidation, decided before the trade, not during it.
Your Bets Are Correlated
The last trap is the one that ambushes disciplined traders: the belief that risking 1% on each of eight positions means you are risking 8% spread safely around. You are not, if those positions move together. Five long tech stocks, or a basket of altcoins, or three currency pairs that all track the dollar, are not eight independent bets — they are one bet wearing eight coats, and on the day the theme turns they all lose at once. This is how careful traders still blow up: each position looked small, but the aggregate exposure to a single driver was enormous. Manage risk at the portfolio level, not just the trade level. Put a number on it: keep your total open risk — the sum of what every position would lose if each hit its stop, sometimes called your portfolio heat — under roughly 6% of the account, and count several positions driven by the same theme as one bet against that budget. In a real crisis correlations rush toward one and everything you own becomes the same trade, so the cap is what stops a themed portfolio from quietly turning into a single, oversized position. Sizing each position perfectly is worthless if you own the same risk ten times, which is a large part of why strategies that look safe on paper blow up live.
FAQ
How much should I risk per trade?
A common ceiling is 1% to 2% of your account on any single trade, and less while your edge is still unproven. The exact number matters less than the principle: it must be small enough that a realistic losing streak — ten or twenty in a row — leaves you with plenty of capital to keep trading.
Can I trade without a stop-loss if I keep sizes tiny?
Small size limits the damage of an ordinary loss, but it does not cap the tail: a gap or a black-swan move can blow through your intended risk while you are away from the screen. Size controls your routine losses; a stop controls the rare catastrophic one. Serious traders use both.
What drawdown is realistically recoverable?
Any drawdown is recoverable in theory, but recovery is asymmetric — a 50% loss needs a 100% gain to erase it, and a 90% loss needs a tenfold return that almost never arrives. Keep your drawdowns shallow enough that the required comeback is realistic, which in practice means staying in the top rows of the recovery table above.
Is a 2:1 reward-to-risk ratio enough to be safe?
Reward-to-risk and safety are different questions. A 2:1 payoff only produces profit alongside a sufficient hit rate — that trade-off is the subject of win rate versus reward-to-risk. Risk management is about surviving the losing runs regardless of your ratio, through position size and exposure limits.
What actually blows up trading accounts?
Rarely a single bad trade. It is almost always over-sizing, hidden correlation (many “different” positions that are really one bet), and moving or removing stops under pressure. Blow-ups are a failure of size and discipline compounding together, not one unlucky loss.
Author’s Insight
Early on I thought risk management was about being smart — picking better trades so I would lose less often. The account that taught me otherwise did not die on a bad trade; it died on a good idea sized far too large during a losing streak I was sure had to end. Six normal losses in a row, each one bigger than it should have been, and half the account was gone before the strategy ever got the chance to work. What changed my results was not a better indicator. It was fixing my risk at a small percentage per trade and refusing to move a stop once it was set, so that no run of bad luck could take me out of the game. My win rate barely moved. My survival did, and survival is the only thing that lets a real edge compound.
Bottom Line
You will never blow your account if you accept that losses are unavoidable and manage their size instead of pretending you can dodge them. Survival comes first, because a deep drawdown is arithmetically brutal to recover. Position size — not the stop — is the lever that controls ruin, so risk a small fixed fraction that any losing streak can survive. Set stops at the price that proves you wrong and take them automatically, and manage your true exposure at the portfolio level, because correlated bets are one bet. Do that, and the worst a cold streak can do is bruise you, which is the entire point: stay in the game long enough for your edge to pay.