Every article promising to help you "predict the next bear market" makes the same quiet promise: that with the right checklist of indicators, you'll see the top coming and step aside in time. After two decades watching cycles, I've come to believe that promise is the trap. Nobody rings a bell at the top, and the people most confident they've spotted it are usually the ones who sell too early in one cycle and freeze at exactly the wrong moment in the next.
So this piece is built on a different premise. You cannot reliably time the top — but you can read how fragile the system has become, and fragility is something you act on with position size, not a calendar. The goal isn't a prediction. It's a portfolio that survives being wrong about timing.
You Can't Time the Top
A bear market is conventionally defined as a fall of 20% or more from a recent peak — but knowing the definition doesn't help you dodge one. Start with an honest look at what "predicting" a bear market even means. A recession isn't declared in real time; in the United States it's dated by the National Bureau of Economic Research, often many months after it began (NBER Business Cycle Dating). If the official scorekeepers need a year of hindsight to say a downturn started, the idea that you'll pinpoint the market top from a dashboard of indicators should invite some humility.
The deeper problem is that market tops are built out of consensus, and consensus is invisible from the inside. When every strategist is forecasting a "soft landing" and your most cautious friends are asking how to buy call options, that is the warning — but it never comes with a date attached. This is exactly why the market's favorite narratives are so often wrong: by the time a story is universally believed, it's already priced in, and the surprise can only come from the other direction.
Watch the Plumbing, Not Prices
If the headline index is the last thing to break, where do you look first? The plumbing — the credit and liquidity systems underneath the stock market. Prices can stay euphoric while the financing that supports them quietly dries up, and that stress shows up in the bond market before it shows up in your equity screen.
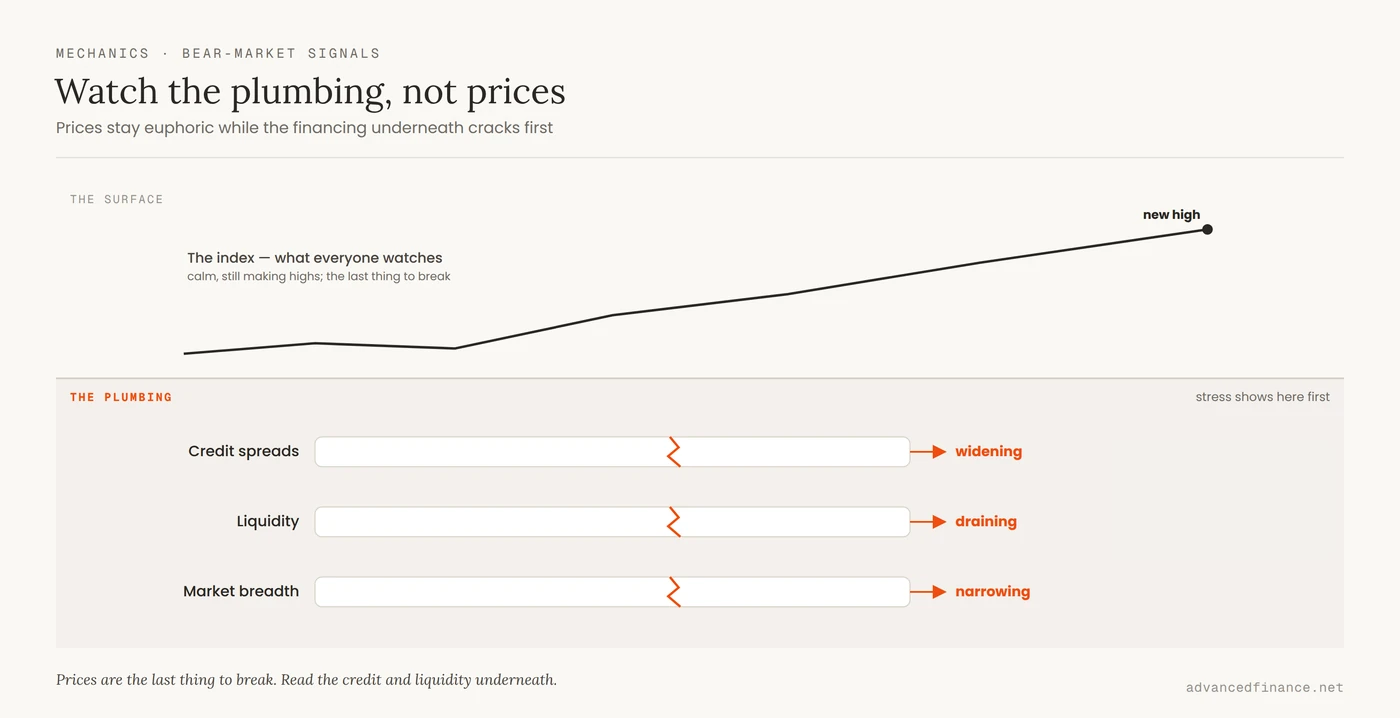
The single most useful gauge is the spread on high-yield corporate debt: the extra yield investors demand to hold risky company bonds over safe Treasuries. When that spread is tight, credit is flowing and risk appetite is healthy; when it starts widening, lenders are getting nervous, and equities are usually next. You can watch it yourself — the ICE BofA US High-Yield spread is published free and updated daily (FRED, high-yield OAS). As rough historical orientation, a spread under about four percentage points reflects calm credit, while a push past roughly seven or eight points has marked genuine stress — and in the 2008 crisis it blew out toward twenty. Pair that with the broader question of how liquidity cycles decide when markets really turn, and you're reading the fuel gauge instead of the speedometer.
Breadth: is the rally narrowing?
A healthy advance has many stocks participating; a fragile one is a handful of giants dragging a tired index higher. When the market prints new highs while the advance-decline line — a running tally of how many stocks rise versus fall — drifts lower, the rally is hollowing out. It doesn't date the top, but a narrowing market is a more brittle one, and it argues for tighter stops and less fresh risk.
Liquidity: who's adding or draining fuel?
Risk assets run on liquidity, and the biggest tap is the central bank. When policy tightens and the balance sheet shrinks, there's simply less fuel for speculative positioning and the marginal buyer thins out. You don't need to forecast the precise effect; you just note that draining liquidity makes every other fragility signal bite harder, and you let it nudge your cash level up.
What the Yield Curve Really Says
The most famous warning sign is the inverted yield curve — when short-term Treasury yields rise above long-term ones. It has a genuinely good track record: the Federal Reserve Bank of New York maintains a recession-probability model built almost entirely on the Treasury yield spread, because an inverted curve has preceded most modern U.S. recessions (New York Fed, the yield curve as a leading indicator).
But "good track record" is not "stopwatch." The lag between an inversion and an actual downturn has historically run from several months to well over a year, and it varies every cycle. Worse, the more dangerous moment is often not the inversion itself but the un-inversion — when the curve rapidly steepens back to normal, which has tended to coincide with the recession actually arriving. You can track the 10-year-minus-2-year spread yourself (FRED, 10Y−2Y spread). Treat it as a rising probability, never as a countdown clock.
| Curve inverted (10Y−2Y) | Recession began (NBER) | Approx. lead time |
|---|---|---|
| Early 2000 | March 2001 | ~12–13 months |
| Mid-2006 | December 2007 | ~18 months |
| August 2019 | February 2020 | ~6 months |
Same signal, wildly different lead times — which is exactly why it belongs on a probability dial, not a calendar.
Valuation Isn't a Trigger
A lot of "the crash is coming" arguments lean on valuation — usually the cyclically adjusted price-to-earnings ratio, or CAPE, popularized by Robert Shiller, whose data is freely available (Shiller, online data). And there is a real relationship there: historically, when you buy at a high CAPE, your long-run returns tend to be lower.
What CAPE does not do is tell you when. A market can stay expensive for years, and plenty of investors have gone broke shorting a "bubble" that kept inflating. High valuation is a condition, not a trigger — it tells you the downside is larger if something breaks, not that it's about to. Use it to size your expectations and your risk, not to set an exit date.
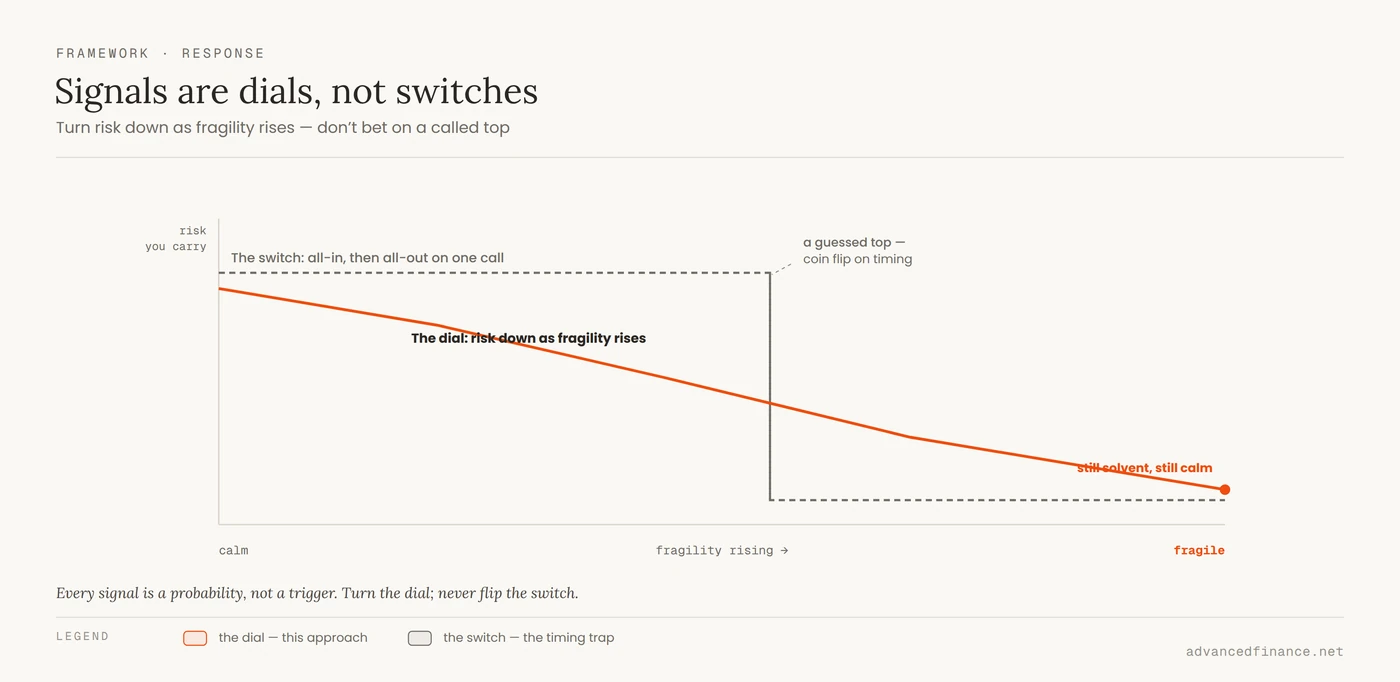
A Fragility Checklist
Put the honest signals together and the point of the exercise becomes clear: none of them is a sell button. Each one nudges a probability, and the correct response to a rising probability is to carry less risk — not to bet the account on a called top.
| Signal | Where to read it | What it hints | Sane response |
|---|---|---|---|
| High-yield spreads widening | FRED (high-yield OAS) | Credit is tightening | Trim the riskiest holdings first |
| Yield curve inverting or fast un-inverting | FRED / NY Fed model | Recession odds rising | Build ballast, don't chase |
| Narrowing breadth (fewer names leading) | Advance-decline line | The rally is thinning | Tighten stops, add hedges |
| Liquidity draining (tightening policy) | Central-bank balance sheet | Less fuel for risk assets | Raise cash gradually |
Notice the responses are all dials, not switches. You are turning risk down as fragility rises, keeping yourself solvent and calm enough to act — the opposite of the all-or-nothing bet that "predicting" the top invites.
Position for It, Don't Predict It
Here's the reframe that has actually protected capital for me: stop trying to be right about when, and build a portfolio that doesn't need you to be. If a plausible bear market can't do catastrophic damage to you, you no longer need the impossible forecast.
Two habits do most of the work. First, know your damage in advance — stress-test your portfolio before the drawdown arrives, so a 30–40% equity fall is a number you've already rehearsed rather than a shock that makes you sell at the bottom. Second, shape the portfolio so both tails are survivable — the logic behind a barbell portfolio built for uncertain times, pairing safe ballast (cash and short-term Treasuries) with a smaller sleeve of growth, and little of the fragile middle that gets hurt most in a credit event.
| Sleeve | What's in it | Its job |
|---|---|---|
| Ballast (large) | Cash, short-term Treasuries | Survive the drawdown, stay liquid |
| Growth (smaller) | Quality assets you'll hold through it | Capture the recovery |
| The fragile middle (near zero) | Leverage, junk quality, crowded trades | Avoided — it breaks first |
The exact weights depend on your goals and horizon, so treat this as a shape rather than a prescription. Get that shape right, and the bear market stops being a threat you must predict and becomes a weather event you're dressed for.
FAQ
Can the yield curve actually predict a recession?
It's the best single signal we have — the New York Fed even publishes a recession-probability model built on it — but it's slow and imprecise. Past inversions led the recession by roughly six months (2019), about a year (2000), and around eighteen months (2006): the same signal, very different timing. Read it as a probability that should trim your risk, and pull the current reading from the live sources yourself rather than trusting a headline.
Is a high P/E or CAPE a reason to sell everything?
No. A high CAPE reliably predicts weaker returns over the following decade, not a crash next quarter — markets have stayed expensive for many years at a stretch. Let it lower your return expectations and your position sizes; don't let it set an exit day.
What's the single best bear-market indicator?
There isn't one, and anyone selling a magic signal is selling false certainty. The credit-and-liquidity plumbing is the most reliable family — as rough orientation, high-yield spreads under about four points reflect calm while a push past seven or eight marks real stress — because that stress appears before it reaches stock prices. Even so, it gives you a regime, not a date.
What should I actually hold going into a possible bear market?
Not an all-in cash bet on a hunch — that's market timing with extra steps. A barbell shape travels better: a large ballast of cash and short-term Treasuries, a smaller growth sleeve you'll hold through the storm, and almost nothing in the leveraged, crowded middle that breaks first. The exact split depends on your goals and horizon; the shape is what protects you.
Everyone's forecasting a soft landing — does that mean it's safe?
Universal calm is precisely when fragility hides, because a fully believed story is already in the price and can only surprise on the downside. That doesn't make consensus always wrong — it means consensus carries no protective information. Take your cue from the live plumbing readings and your own positioning, not from how confident the crowd sounds.
Author's Insight
If I've learned one thing from watching several of these cycles up close, it's that the trigger for the next bear market is almost always something people had stopped talking about six months earlier — a corner of the credit system, a leverage build-up, a "safe" trade that quietly got crowded. I no longer try to name it in advance, because I've been wrong doing that more than once. What I do instead is watch the plumbing for signs of strain and keep my portfolio built so that being wrong on timing costs me a comfortable night's sleep rather than a decade of recovery. The humbling truth is that the investors who come through bear markets best are rarely the ones who predicted them — they're the ones who were simply never positioned to be destroyed by one.
Bottom Line
Predicting the exact top is a game you're set up to lose, and the effort itself pushes you toward all-or-nothing bets. The winnable game is reading fragility — credit spreads, the yield curve, liquidity, and valuation as a measure of downside rather than a clock — and letting it dial your risk up or down. Watch the plumbing, not the headlines; treat every signal as a probability rather than a trigger; stress-test your holdings and build a barbell that survives both tails. Do that, and you won't need to predict the next bear market. You'll simply be ready for it whenever it comes.