Understanding Charts
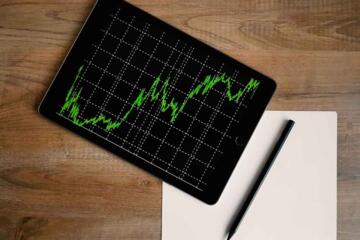
Stock charts graphically represent price movements for a security over time. You’ll find them everywhere—on brokerage platforms like Fidelity, in apps like Robinhood or ThinkorSwim, and financial sites such as Yahoo Finance. One simple line shows how prices changed during a day, week, or month.
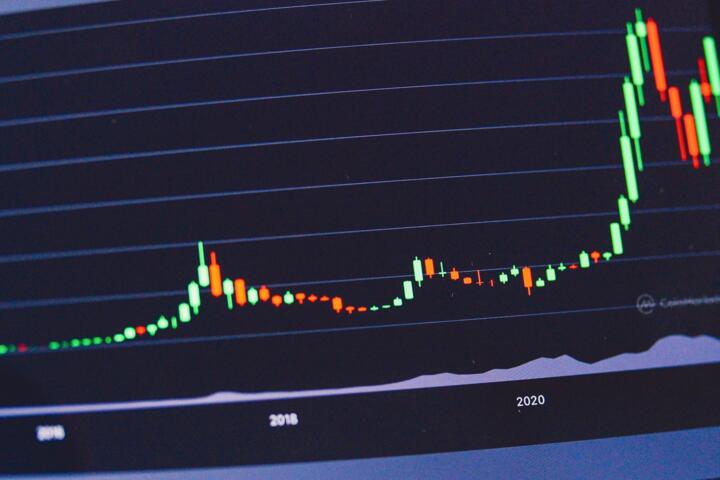
Candlestick charts are popular because they pack more information per unit of time. Each candle shows the open, high, low, and close prices for a given period. For example, in 2023, 95% of retail traders preferred candlesticks for day trading decisions. Real-world traders watch those candles closely to sense market mood shifts.
Charts also come with volume bars. These colors and heights tell how many shares traded that session. A price jump on heavy volume often signals strength.
Charts answer 'what happened?' and hint at 'what might happen?' — but to see why price moved you have to look at the order flow behind the chart.
Chart Reading Problems
Misreading stock charts can cost money. Many beginners latch onto price alone without volume or ignore patterns’ context. This mistake makes you chase moves instead of anticipating them — the difference between a random entry and a high-probability setup built from context. You might buy high, thinking the price will climb more, only to watch it reverse.
Another pitfall is relying too much on complex technical indicators without understanding their logic. For example, entering a trade just because the 50-day moving average hit the 200-day moving average ignores market conditions. Indicators sometimes lag — giving false signals.
Ignoring the bigger picture or time frames can confuse you. A chart that looks bullish at the daily scale might be bearish weekly.
Traders lose money because they trade noise and miss signals hidden in chart details.
How to Read Charts
Select the Right Chart Type
Candlestick charts reveal price action clearly by showing opens, closes, highs, lows in colored boxes. Line charts are simpler but don’t show intra-day moves. Bars give you ranges like candlesticks but lack the visual punch. Candlesticks often provide signals faster, especially when patterns like hammers or shooting stars form.
For beginners, start with candlesticks on platforms like TradingView or E*Trade because they provide integrated pattern alerts. A recent survey found 80% of novice traders found candlestick patterns easier to learn than indicators.
Understand Time Frames
Charts can display price behavior over different intervals: minutes, hours, days, weeks, months. Your choice depends on your trading style.
Think short-term scalpers using 1- or 5-minute charts. Swing traders prefer daily charts where trends form more clearly. Investors might only glance weekly or monthly charts for broader trends.
Confusion arises when mixing time frames—don’t do it without reason. Focus on one or two time frames first. This reduces noise and sharpens trend recognition.
Watch Volume Closely
Volume confirms price moves. A breakout on light volume might be a false start; a reversal on heavy volume signals real strength. If a stock gaps up 5% but volume drops by 40%, caution is wise.
Look for volume spikes coinciding with price changes. Tools like ThinkorSwim provide volume overlays and moving average volume lines that smooth spikes.
Identify Simple Trends and Patterns
Spot upward or downward trends by watching how price makes a series of higher highs and higher lows or lower highs and lower lows. A trendline drawn along these points helps visualize direction.
Beyond trends, familiar patterns like head and shoulders, double tops, flags, and triangles often precede breakouts or reversals. Recognition requires practice, but charting apps offer pattern drawing tools that simplify this.
Apply Moving Averages Smartly
Moving averages smooth out price fluctuations by averaging past closing prices over a chosen period, often 20, 50, or 200 days. A simple moving average (SMA) plots these averages. When the price is above the 200-day SMA, many see long-term strength.
The crossover of shorter and longer moving averages, such as the 50-day crossing above the 200-day (the “golden cross”), can mark major buy signals. But beware lag; averages react after prices move.
Use RSI and MACD with Caution
The Relative Strength Index (RSI) measures how overbought or oversold a stock is on a scale from 0 to 100. Values above 70 might warn of a pullback. MACD tracks momentum by comparing moving averages.
Both indicators add a filter for timing entries or exits but don’t rely on them blindly. They often contradict each other or give early signals, frustrating many beginners.
Check News and Earnings Dates
Chart signals are meaningless if they ignore fundamental events like earnings releases or sector news. A spike on a chart followed by a 20% gap down after earnings is common.
Set alerts on earnings dates using tools like Yahoo Finance or NASDAQ’s calendar, and note those periods in your charts to interpret movements better.
Practice with Paper Trading
Real money is not required to learn chart reading. Many brokers offer paper trading accounts that simulate market conditions with delayed or real-time data. TradeStation and Interactive Brokers have solid paper trading setups.
Spend weeks spotting patterns, applying indicators, and interpreting volume this way. Mistakes in real markets sting hard; paper trading saves capital and builds confidence.
Stay Updated with Reliable Platforms
Platforms like ThinkorSwim, TradingView, and Fidelity offer tools to customize charts, draw trendlines, and layer indicators. Choose one with smooth updates and accurate data timestamps because delayed info leads to wrong decisions.
For example, TradingView’s scripting language, Pine Script (version 5 as of June 2024), allows custom indicators that can highlight breakout points, which traders often overlook.
Real Chart Examples
Consider Tesla in May 2023: after two months of steady rising prices on daily charts, the 50-day SMA crossed above the 200-day SMA. Volume doubled during the cross, a strong sign. Traders who identified this crossover early profited from a swift 12% rally over three weeks.
Another case: A biotech firm, Novavax, showed a head and shoulders pattern on weekly charts starting January 2024, predicting a downtrend. Volume increased on the neckline break. Investors who sold after this pattern avoided a 25% loss in the following month.
Reading Checklist
| Step | Action | What to Watch | Tools/Indicators |
|---|---|---|---|
| 1 | Pick chart type | Candlesticks show more data | TradingView, Fidelity |
| 2 | Choose time frame | Match style & goals | Daily, 1-min, weekly |
| 3 | Look at volume | High volume validates moves | Volume bars, averages |
| 4 | Spot trends & patterns | Higher highs, head & shoulders | Trendlines, drawing tools |
| 5 | Use indicators | Supports timing decisions | MA, RSI, MACD |
| 6 | Check news context | Earnings, sector updates | News alerts, calendars |
| 7 | Practice trades | Build skill, no risk | Paper trading apps |
Major Errors to Avoid
Jumping into trades without a plan leads to confusion. Without a goal, you just follow price movements randomly. Ignore chatter and random signals that look promising—it rarely works.
Overloading charts with many indicators slows clarity; it feels like the apps mess with you, not help. Stick to a few trusted tools and learn to read price first.
Also, skip the timer apps. They add one more thing to manage.
Reading on small time frames without confirmation on higher frames inflates noise and mistakes. Confirm signals on longer charts to avoid entry traps.
Finally, disregard confirmation by volume or news, and you risk trading false breakouts that wipe out your gains.
FAQ
What is the first chart type to learn?
Candlestick charts. They show detailed price info and are widely used for trading decisions.
How can I tell if a trend is strong?
Look for consistent higher highs and lows (uptrend) or the reverse with solid volume supporting price moves.
Are indicators necessary for beginners?
Not necessarily. Indicators help timing but understanding price action and volume leads to better decisions.
What time frame suits new traders best?
Daily charts. They offer less noise, clearer trends, and are simpler to analyze.
Can news affect chart accuracy?
Yes. Significant events can cause price swings not reflected by patterns or indicators alone.
Author's Insight
I started with simple line charts in 2018 before moving to candlesticks, which clarified patterns. Watching volume changed how I viewed breakouts — they aren’t real without solid volume backing. Paper trading saved me months of losses. My advice: keep to a minimal indicator set, learn the price action basics first, and check the news constantly to avoid surprises.
Summary
Reading stock charts begins with mastering candlesticks, understanding time frames, and volume's role. Avoid cluttering graphs with too many indicators early on. Watch real-world examples showing how trends and patterns connect to price moves. Practice via paper trading platforms to sharpen skills responsibly. In markets, simplicity beats complexity, and seeing the core chart story wins.