
Factor investing is the idea that market returns are not one thing but a mix of distinct, persistent drivers — value, momentum, quality, low volatility, size — that you can deliberately tilt toward. It is one of the most rigorously studied ideas in finance, and also one of the most oversold. The honest version is more useful than the marketing version: the factors are real, but several of them have weakened since the academics published them, and after costs and crowding only a disciplined, diversified approach tends to survive. This guide covers what a factor actually is, which ones hold up, why premia decay, and how to tilt toward them without blowing yourself up.
What a Factor Actually Is
A traditional index fund buys the whole market and gives you its return — "beta." A factor is a characteristic that has historically earned a return on top of beta, either as compensation for a specific risk or by exploiting a persistent behavioral mistake. Instead of "I like this company," the systematic investor says "I want the cheapest decile of stocks by cash-flow yield, rebalanced on a rule."
The foundation is the Fama-French model, which showed that size and value explain much of the return that plain market risk does not. The raw evidence lives in the Kenneth French Data Library, the public dataset every serious factor study is built on. This is not fringe theory: BlackRock, AQR, and Dimensional run trillions on it. But "empirically validated" and "will pay you this decade" are different claims, and conflating them is where most investors go wrong. Factor tilting is a refinement of, not a replacement for, sound portfolio construction and risk budgeting.
The Factors That Survive
Four factors have the strongest evidence behind them, and each behaves differently:
- Value — cheap stocks (by free-cash-flow yield or EV/EBITDA, not just price-to-book) beating expensive ones. Over the long run the value premium has averaged roughly 3–4 percentage points a year in the Fama-French data, but it was flat to negative through much of the 2010s — a decade long enough to break most investors' resolve.
- Momentum — recent winners keep winning over 3–12 months. At roughly 8% a year in the long-run US data (Ken French's momentum series) it is the strongest of the major premia, but it pays for that with rare, violent crashes: in sharp market rebounds, momentum can give back years of gains in weeks.
- Quality — profitable, low-debt, stable-earnings companies. AQR's "Quality Minus Junk" research documents a durable if moderate premium; because quality usually loses less in drawdowns, it tends to raise a portfolio's risk-adjusted return more than its raw return.
- Low volatility — documented by Baker, Bradley, and Wurgler: lower-beta stocks have delivered comparable returns at lower risk, contradicting the textbook "more risk, more reward" assumption. The edge is a steadier ride, not a higher raw return.
The Size Premium Problem
Notice which classic factor is missing from that list: size. The "small-cap premium" is the cautionary tale of the whole field. Since the effect was published in 1981, small-cap stocks on their own have barely outpaced large caps, and the premium has been maddeningly inconsistent.
The most cited rehabilitation of it, AQR's "Size Matters, If You Control Your Junk", argues the premium only appears once you strip out the flood of low-quality, unprofitable "junk" small caps — that is, size only pays when combined with quality. That is a very different message from the ETF brochure that tells you small caps simply outperform. Treat any single factor that "works" only after a heroic adjustment with suspicion; it is telling you the raw effect is fragile.
Why Premia Decay
Here is the part the marketing skips. A factor that worked in a backtest is, by definition, a pattern that has already been discovered. And discovery changes the odds.
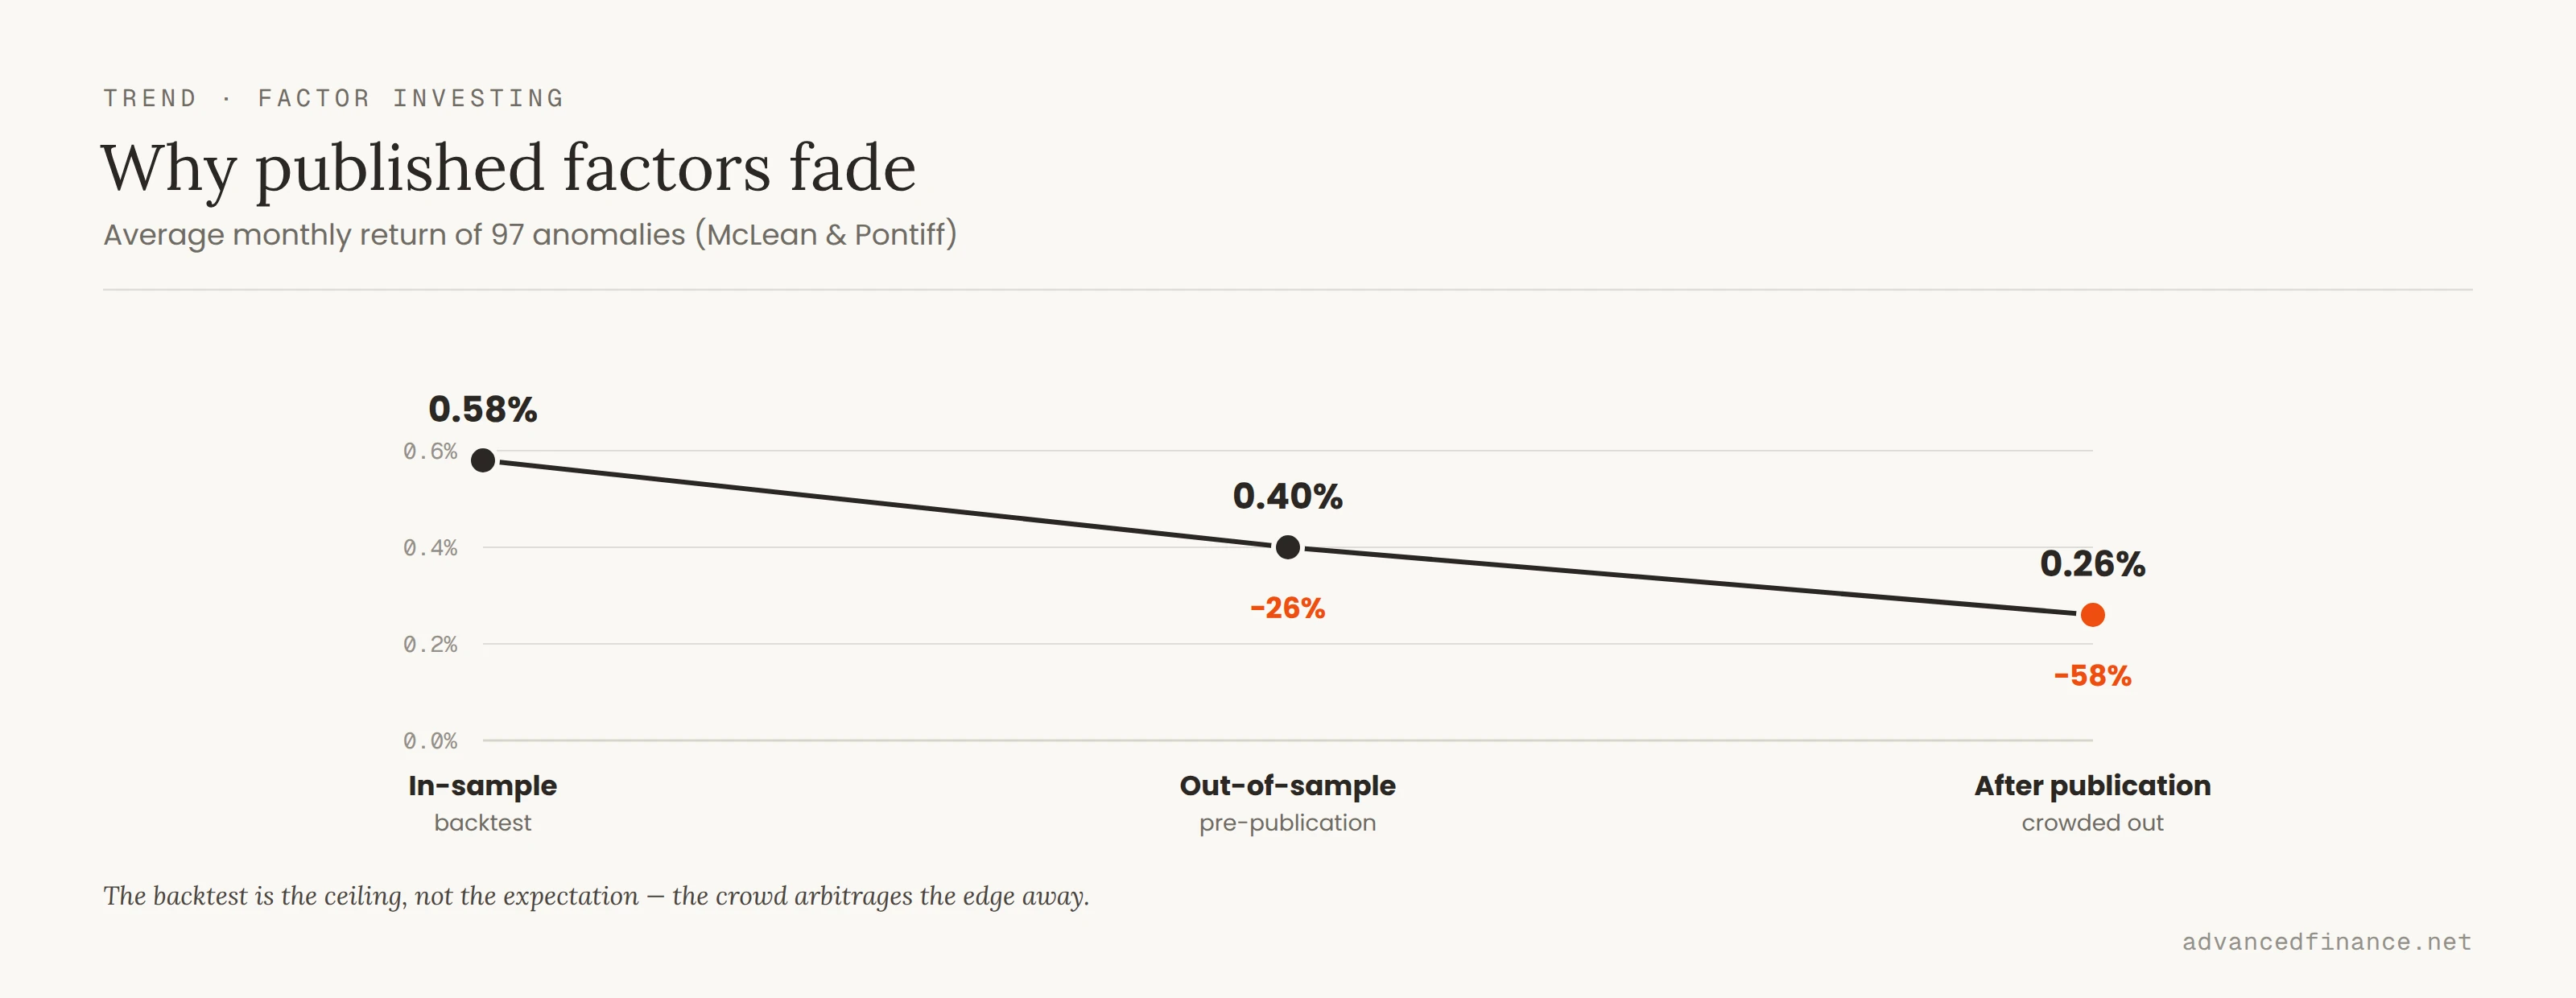
McLean and Pontiff studied 97 published anomalies and found that a strategy's return falls by about 58% after it is published, as investors pile in and arbitrage the edge away — the same decay that erodes a data edge once the dataset is sold to everyone. Crowding does the same thing in real time: when everyone tilts to the same "quality" names, the valuation premium stretches until the trade is fragile at exactly the moment it feels safest. And implementation quietly taxes the rest — turnover, spreads, and fees can consume a large slice of a high-turnover factor's paper return before it reaches your account. The lesson is not that factors are fake. It is that the naive premium you read about is the ceiling, and reality charges rent on the way down.
Building a Multi-Factor Tilt
Because single factors go through long cold streaks — and because you cannot predict which one is next — the durable approach is to combine several so that one compensates for another's quiet years. Value and momentum, in particular, are famously negatively correlated: value tends to lag exactly when momentum soars, and vice versa.
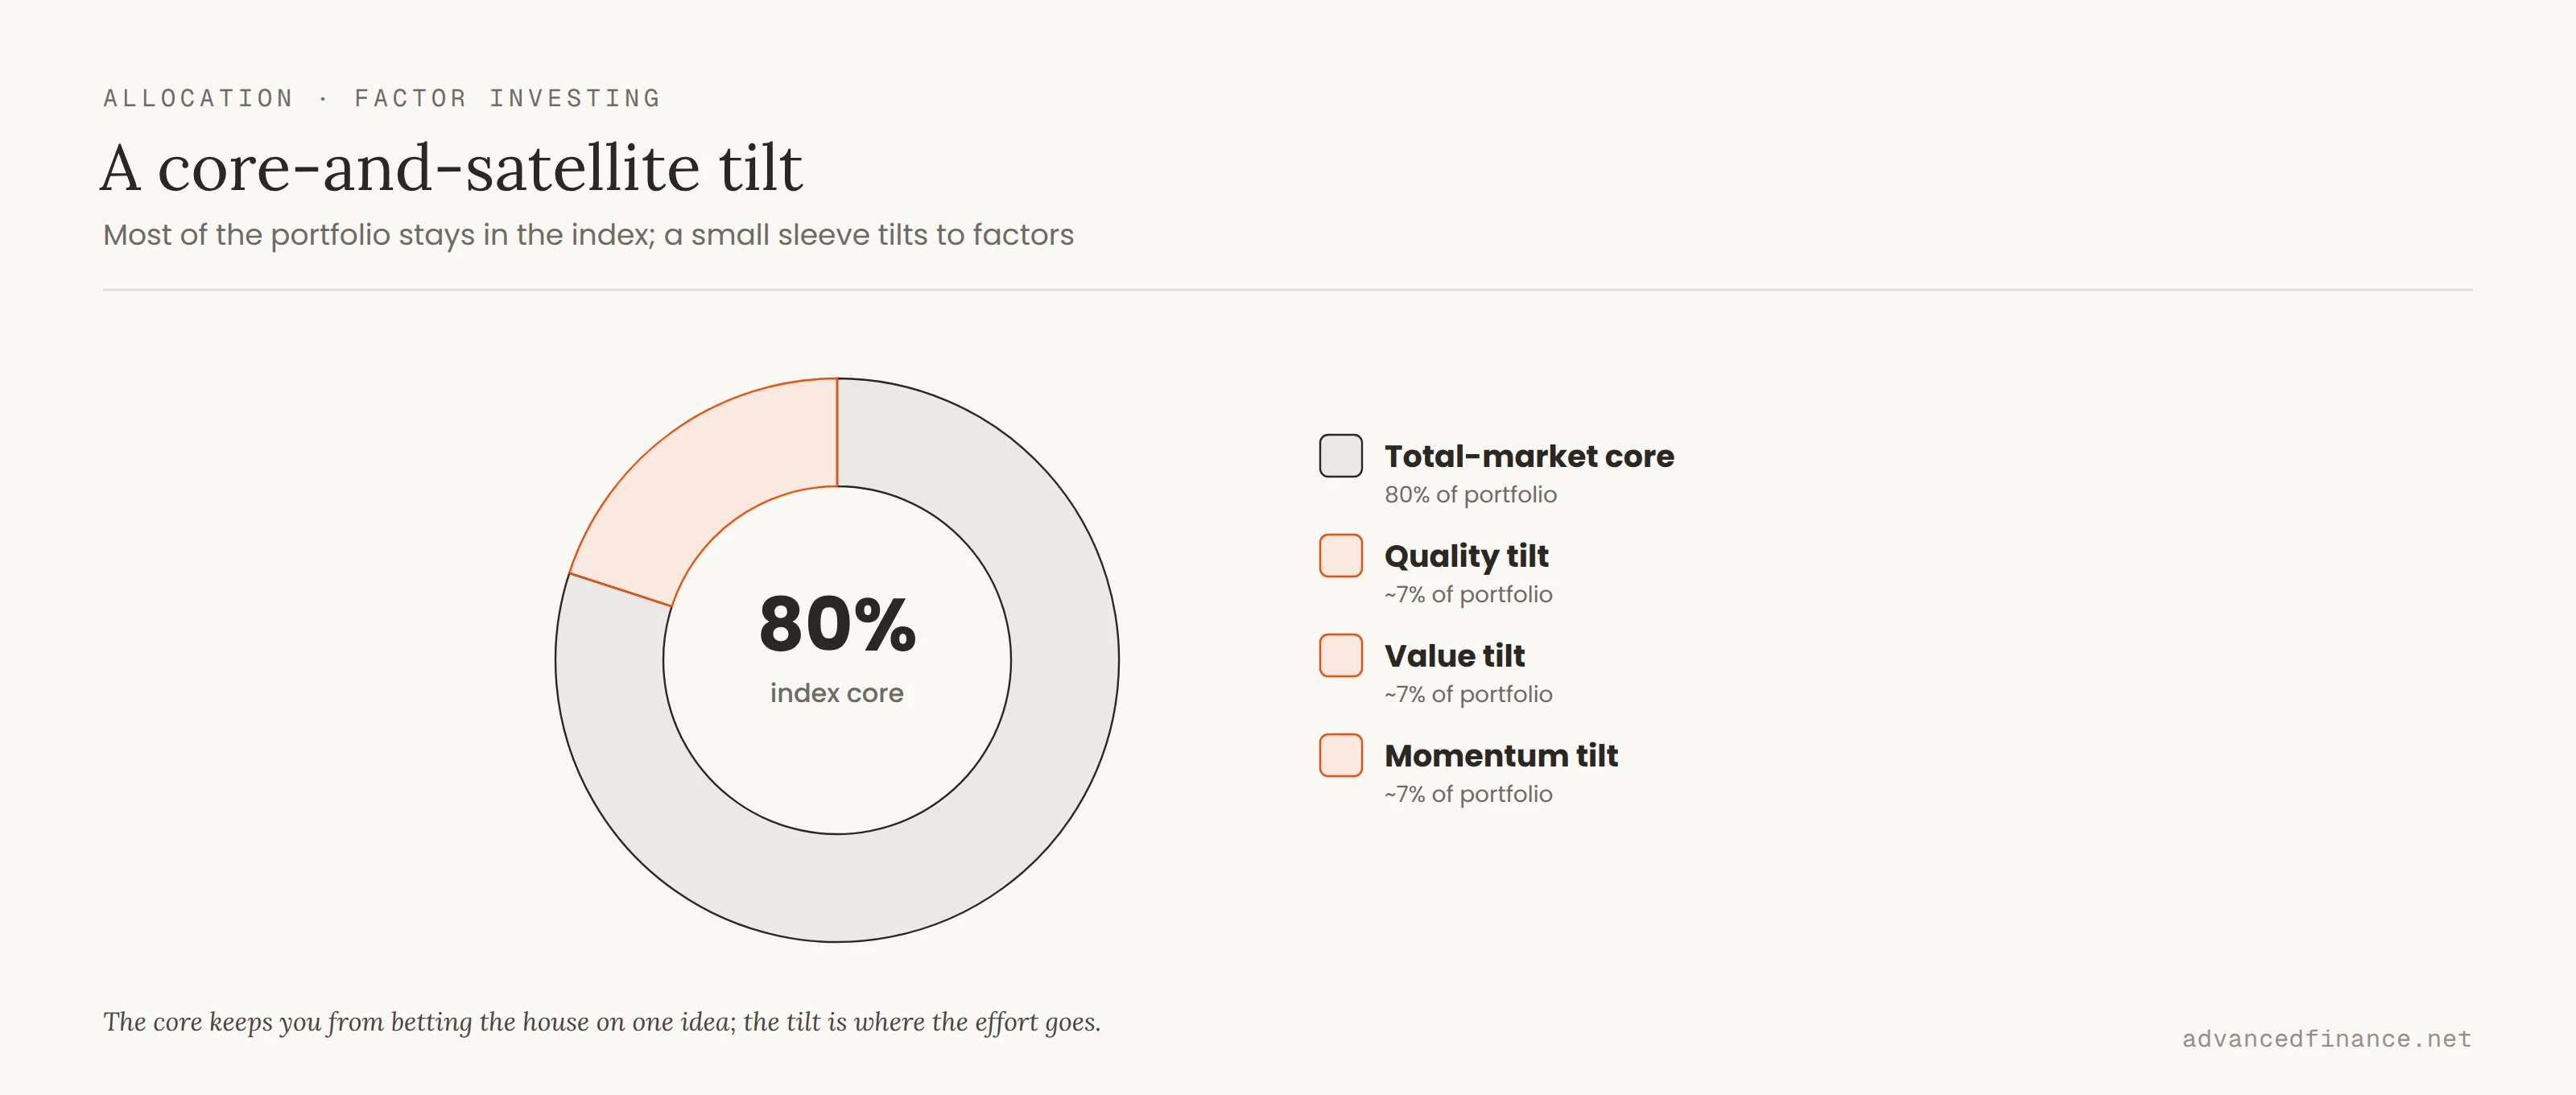
The practical structure most individuals should use is core-and-satellite: keep the majority of the portfolio in a low-cost total-market index and tilt a minority toward two or three robust factors. A concrete version is 80% total-market core and a 20% tilt split across, say, quality, value, and momentum. The tilt is where the effort goes; the core keeps you from betting the house on one idea.
There are two ways to build that tilt. Mixed means holding separate single-factor funds — full control, but one fund can buy exactly what another is selling. Integrated means a single fund that scores every stock across all factors at once, avoiding that internal conflict; for most people a one-ticker multi-factor fund such as iShares' LRGF or Goldman Sachs' GSLC is the simpler default. If you prefer to assemble your own, common single-factor ETFs are:
| Factor | Primary metric | Example ETF | Role |
|---|---|---|---|
| Value | Cash-flow yield | VTV (Vanguard) | Cheapness, mean reversion |
| Momentum | 12-month trend | MTUM (iShares) | Ride persistent trends |
| Quality | ROE / low debt | QUAL (iShares) | Downside protection |
| Low volatility | Beta / std dev | USMV (iShares) | Lower risk, steadier ride |
Two rules keep a tilt honest. First, watch cost: a factor ETF above roughly 0.40% in expense ratio is scrutinizing-worthy, because the cost is the one "factor" with a 100% certainty of dragging on returns. Second, rebalance on a schedule, not a hunch — and do it tax-efficiently, since factor tilts can be turnover-heavy. If you hold them in a taxable account, coordinate with your broader tax-aware rebalancing. And remember a factor tilt is a variation on classic allocation debates like the 60/40 portfolio, not a replacement for having an allocation at all.
The Real Enemy Is You
The math of factor investing is the easy part. The hard part is a feeling called tracking-error regret: the specific pain of watching the S&P 500 rise 20% while your multi-factor portfolio manages 15%, because value is out of favor. That gap is not a bug — it is the price of admission, and it can last years.
This is exactly where factor premia are earned and lost. The investor who abandons a sound, diversified tilt in year three of underperformance locks in the loss and misses the mean reversion that follows — a close cousin of the behavior gap that explains why most long-term investors underperform their own funds. If you cannot stomach looking wrong for a few years at a stretch, factor investing is not for you, and there is no shame in a plain index fund instead.
FAQ
Is factor investing the same as "smart beta"?
Effectively yes. "Smart beta" is the ETF industry's marketing label for products that weight holdings by a factor rather than by market cap. "Factor investing" is the academic term for the same underlying idea.
Do factors work outside US stocks?
Value, momentum, and quality show up in international and emerging-market equities too, and versions of them exist in bonds and other asset classes — part of why researchers treat them as structural rather than a US fluke. The premia are just as prone to long droughts abroad, so the same discipline applies.
Should I use single-factor ETFs or a multi-factor fund?
A single-ticker multi-factor fund is the simpler default and avoids one factor sleeve fighting another. Building your own from single-factor ETFs gives more control over the exact tilt but takes more maintenance and can create internal turnover. For most individuals the one-ticker route wins on cost of effort.
Where should I hold a factor tilt for tax reasons?
Factor tilts — especially momentum and small size — are turnover-heavy, and turnover triggers taxable gains. Where possible, keep the busiest sleeves inside a tax-advantaged account; if they sit in a taxable one, coordinate with tax-aware rebalancing to hold the drag down.
Who should avoid factor investing?
Anyone who cannot sit through multi-year stretches of trailing a rising benchmark without bailing. If tracking-error regret would push you to abandon the tilt at the bottom, a plain low-cost total-market index will serve you better than a strategy you cannot hold.
Author's Insight
After years around quantitative models, my strongest conviction is that the math is not the moat — discipline is. I have watched well-built systems get abandoned in the last inning of a cold streak, right before the mean reversion that would have vindicated them. So I keep my own tilts deliberately boring: a large total-market core, a modest sleeve tilted to quality and value, held through the stretches when they look foolish. I do not expect any single factor to save a bad decade, and I never size a tilt so large that a two- or three-year drought would make me quit. The edge is small, real, and only available to people who can sit still.
Bottom Line
Factor investing is evidence-based, not magic. Value, momentum, quality, and low volatility have real, studied premia; size is weak on its own; and every published edge decays as the crowd arrives. The workable approach is a low-cost total-market core with a modest, multi-factor tilt, rebalanced on a schedule and held through the inevitable cold streaks — because the biggest risk is not the model, it is your own urge to abandon it. Start by checking your current holdings for hidden factor overlap, then tilt gradually and deliberately toward a diversified, rule-based mix.