Intraday Market Dynamics
Day trading is the practice of purchasing and selling financial instruments within the same trading session, ensuring all positions are closed before the market bell. Traders who instead carry positions through the close move into swing trading, holding for several days to capture a mid-term trend. Unlike long-term investing, which relies on fundamental growth, intraday trading capitalizes on small price movements fueled by news, earnings reports, or technical breakouts. It is a game of probability, not certainty.
For example, a trader might watch NVIDIA (NVDA) during an earnings release. While a long-term investor holds through the volatility, a day trader looks for a specific "VWAP (Volume Weighted Average Price) pull-back" on a 1-minute chart to capture a $2.00 move in twenty minutes. This requires intense focus and the ability to process data in real-time.
Statistically, the barrier to entry is low, but the barrier to success is steep. Data from the Brazilian Securities Commission (CVM) suggests that 97% of individuals who day trade for more than 300 days lose money. Only the top 1.1% earn more than the minimum wage. Understanding this emphasizes that trading is a professional endeavor requiring a business-like approach rather than a hobbyist mindset.
Trading Obstacles
Most beginners fail because they treat the stock market like a digital casino. The most common error is "revenge trading"—the psychological urge to immediately win back lost capital by doubling down on a losing position. Beating it is less about grit than about the trading psychology that keeps fear and greed off the button. This behavior ignores the mathematical reality of risk-of-ruin, where a series of emotional bets leads to a total account "blow-up."
Another significant pain point is the "PDT Rule" (Pattern Day Trader) in the United States, which requires traders to maintain a minimum of $25,000 in equity to execute more than three day trades in a five-business-day period. Many beginners attempt to bypass this with offshore brokers, often exposing themselves to predatory fee structures and lack of regulatory protection.
Technological lag is a silent killer. Using a standard retail banking app with 15-minute delayed quotes is a recipe for disaster. When the market moves in milliseconds, being "late" to a price point means you are the liquidity for professional firms using fiber-optic connections and high-frequency algorithms. This imbalance leads to "slippage," where your order is filled at a much worse price than expected, eating into already thin margins.
Strategic Solutions
H3: Establishing a Professional Hardware and Data Environment
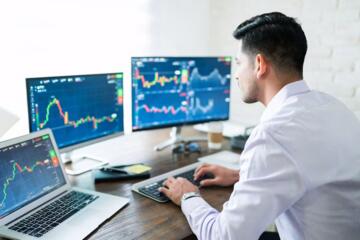
To compete, you must eliminate technical latency. A professional setup starts with a hardwired fiber-optic internet connection—never trade on public Wi-Fi. Your PC should have a minimum of 16GB RAM and a multi-monitor setup to track the S&P 500 (SPY) alongside your target stocks.
Subscribe to a Level 2 data feed. While Level 1 shows the current Bid and Ask, Level 2 shows the "order book"—the depth of buyers and sellers at different price levels. Tools like Bookmap allow you to see where large institutional "iceberg" orders are sitting, giving you a map of where the price is likely to stall or reverse.
H3: Selecting a Direct Access Broker (DAB)
Standard brokers often sell your order flow to market makers (Payment for Order Flow). For day trading, you need a Direct Access Broker like Interactive Brokers (IBKR) or Lightspeed. These platforms allow you to route your orders directly to specific exchanges like ARCA or NASDAQ.
Direct routing results in faster execution and better fills. For a trader moving 1,000 shares, a 2-cent improvement in fill price translates to an extra $20 per trade. Over 500 trades a year, that is a $10,000 difference in your bottom line. Use Das Trader Pro as your execution interface for its industry-standard hotkeys and stability.
H3: Mastering the Risk-to-Reward Ratio
Professional trading is about losing "small" and winning "big." You should never risk more than 1% of your total account balance on a single trade. If you have $30,000, your maximum loss per trade is $300. This is your "R" (Unit of Risk).
A successful strategy requires a minimum risk-to-reward ratio of 1:2. This means if you risk $300, your profit target must be at least $600. With this math, you can be wrong 60% of the time and still remain profitable. Use a Trading Journal like Tradersync or Tradervue to track these metrics automatically; they identify which days and setups are costing you money.
H3: Developing a Rule-Based Entry Strategy
Avoid "guessing" where the price will go. Instead, wait for a proven technical setup, such as the "Opening Range Breakout" (ORB). This involves watching the high and low of the first 5 or 15 minutes of the trading day. When the price breaks above the high with high volume, it signals momentum.
Incorporate the VWAP indicator. Institutional buyers use VWAP to determine the fair value of a stock for the day. If the price is significantly above VWAP, it is considered "extended," and buying there is high risk. Trading near the VWAP line provides a natural "stop loss" point, keeping your risk defined and manageable.
H3: Cultivating the Psychological "Stoic" Mindset
The market is a sea of uncertainty that triggers our "fight or flight" response. Emotional resilience is built through a "Process-First" mindset. Instead of focusing on the dollar amount won or lost, focus on whether you followed your plan. Did you set your stop loss? Did you wait for the setup?
Read "Trading in the Zone" by Mark Douglas. It is the gold standard for understanding that every trade is an independent event with a random outcome. By detaching your self-worth from the result of a single trade, you prevent the emotional spirals that lead to catastrophic account failures.
H3: Utilizing Real-Time Scanning Tools
You cannot watch 5,000 stocks simultaneously. Use a real-time scanner like Trade Ideas to filter for stocks that meet your criteria (e.g., "Gap up > 4%", "Relative Volume > 3.0"). These tools use AI to alert you to unusual activity before the move happens.
Focus on "Stocks in Play"—tickers with a fresh catalyst like a clinical trial result or a CEO resignation. These stocks have higher liquidity and more predictable volatility. A stock with a "Low Float" (fewer shares available to trade) will move much faster, providing more opportunity but requiring even tighter risk controls.
Practical Case Studies
The Gap and Go Setup: A Tech Sector Example
Scenario: An individual trader identified AMD gapping up 5% pre-market due to a positive analyst upgrade. The trader used Trade Ideas to confirm the stock had a "Relative Volume" of 5.0, meaning it was trading five times its usual volume.
Action: The trader waited for the 2-minute "Bull Flag" pattern. They entered at $160.50 with a stop loss at $159.80 (risking $0.70 per share). The profit target was set at $162.00 (a 1:2.1 ratio).
Result: The trade hit the target in 14 minutes. By risking $350 (500 shares), the trader realized a $750 profit. The success was due to filtering for volume and maintaining a strict risk-to-reward ratio.
The Failed Breakout: Risk Management in Action
Scenario: A trader attempted to buy a breakout on Tesla (TSLA) at a key resistance level of $200. The market overall (S&P 500) began to sell off simultaneously.
Action: Instead of hoping for a recovery, the trader had a "Hard Stop" order sitting at $199.20. As soon as the price dipped, the broker automatically sold the position.
Result: The trader lost $0.80 per share. However, TSLA continued to drop to $195.00 by mid-day. By accepting a small, controlled loss, the trader preserved 80% of the capital they would have lost if they had "held and hoped."
Tool Comparison Matrix
| Tool Category | Recommended Service | Key Feature for Beginners | Estimated Cost (Monthly) |
|---|---|---|---|
| Direct Access Broker | Interactive Brokers | Low commissions, global access | $0 - $10 (Activity based) |
| Execution Platform | DAS Trader Pro | Instant hotkeys, Level 2 data | $100 - $150 |
| Market Scanner | Trade Ideas | AI-driven trade alerts | $80 - $170 |
| Charting Software | TradingView | Web-based, vast indicator library | $0 - $60 |
| Trading Journal | TraderSync | Psychology and mistake tracking | $30 - $80 |
Pitfalls and Strategies
One of the most dangerous habits is "Overtrading." Beginners often feel they must be in a position at all times. This leads to taking "C-Grade" setups out of boredom. Professional traders often spend 90% of their time watching and only 10% executing. If the market doesn't provide a setup that fits your criteria, the best trade is no trade.
Ignoring the "News Feed" can lead to unexpected losses. Always have a tool like Benzinga Pro open. If a stock suddenly drops $5 for no apparent technical reason, there is likely a breaking news headline. Trading through high-impact news without knowing the context is essentially gambling against algorithms that read the text in microseconds.
Failing to "Pay Yourself" is a long-term mistake. Many traders grow an account to $50,000 and then lose it all because they never withdrew profits. Treat trading like a business: pay yourself a monthly salary from your gains. This makes the money "real" and reduces the temptation to take unnecessary risks with a larger-than-necessary balance.
FAQ
How much money do I really need to start day trading?
While you can start with small amounts in crypto or forex, U.S. equities effectively require $25,000+ due to the PDT rule. If you have less, consider "Cash Accounts" where you are limited by your settled funds, or explore "Proprietary Trading Firms" (Prop Firms) where you trade the firm's capital after passing an evaluation.
Can I day trade while working a full-time 9-to-5 job?
It is difficult but possible if you focus on the "Market Open" (9:30 AM to 10:30 AM EST). Most of the day's volume and volatility occur in the first hour. Many successful traders only trade this window and then go about their workday, as the mid-day market is often stagnant.
What is the best technical indicator for a beginner?
There is no "holy grail," but the VWAP (Volume Weighted Average Price) is the most critical for intraday traders. It combines price and volume to show the true average price paid. Combining VWAP with the 9-period and 20-period Exponential Moving Averages (EMA) provides a solid foundation for trend following.
How long does it take to become consistently profitable?
Most professional traders report a "learning curve" of 6 to 24 months. This period is usually spent in "The Red" (losing money) while learning the mechanics and psychology. Using a "Paper Trading" simulator for the first 3 months is highly recommended to learn the platform without financial risk.
Is day trading the same as gambling?
If you have no edge, no risk management, and no plan, yes. However, professional day trading is a form of risk management. Like an insurance company, a trader uses statistics to ensure that over 1,000 trades, the mathematical edge results in a profit, despite individual losses.
Author’s Insight
In my years observing the markets, I’ve found that the most successful traders are the ones who are the most "boring." They don't look for excitement; they look for their specific edge and execute it like a machine. My biggest breakthroughs didn't come from a new indicator, but from finally limiting myself to just two trades per day. This forced me to be incredibly selective. My advice to you: spend more time on your journal than on your charts. Your data will tell you exactly where you are failing if you are brave enough to look at it.
Summary
Success in intraday trading is built on a foundation of professional-grade tools, rigorous risk management, and a disciplined psychological approach. By prioritizing capital preservation and focusing on high-probability setups like the VWAP pull-back or ORB, beginners can navigate the volatility of the markets. Start by securing a Direct Access Broker, mastering a 1:2 risk-to-reward ratio, and treating every trade as a business transaction. The goal is not to get rich in a day, but to develop the skills that allow you to trade for a lifetime.